shown below are three scatter plots and their lines of best fit. also shown are three residual plots. answer…
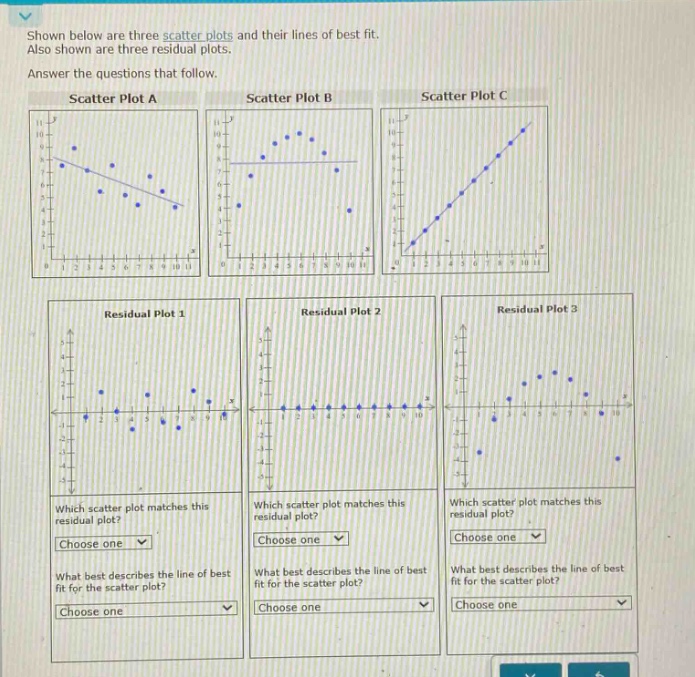
shown below are three scatter plots and their lines of best fit. also shown are three residual plots. answer the questions that follow. scatter plot a scatter plot b scatter plot c residual plot 1 residual plot 2 residual plot 3 which scatter plot matches this residual plot? choose one which scatter plot matches this residual plot? choose one which scatter plot matches this residual plot? choose one what best describes the line of best fit for the scatter plot? choose one what best describes the line of best fit for the scatter plot? choose one what best describes the line of best fit for the scatter plot? choose one
Answer
Explanation:
Step1: Recall residual plot concept
Residuals are the differences between the observed and predicted values. A good - fit line has randomly scattered residuals around the horizontal axis in the residual plot.
Step2: Analyze Residual Plot 1
Residual Plot 1 has residuals randomly scattered around the horizontal axis. This indicates a good - fit line. Scatter Plot A has a linear relationship and its residuals would likely be randomly scattered, so Residual Plot 1 matches Scatter Plot A. The line of best fit for Scatter Plot A is a good fit as the residuals are randomly distributed.
Step3: Analyze Residual Plot 2
Residual Plot 2 has all residuals close to zero and evenly distributed along the horizontal axis. This implies a perfect - fit (or near - perfect) horizontal line. Scatter Plot B has a horizontal relationship, so Residual Plot 2 matches Scatter Plot B. The line of best fit for Scatter Plot B is a horizontal line which fits the data well as there is no vertical variation in the data points with respect to the independent variable.
Step4: Analyze Residual Plot 3
Residual Plot 3 has a non - random pattern of residuals (a curve - like pattern). This indicates that the linear model is not a good fit for the data. Scatter Plot C has a non - linear (curved) relationship, so Residual Plot 3 matches Scatter Plot C. The line of best fit for Scatter Plot C is a poor fit because the non - random pattern of residuals shows that a non - linear model would be more appropriate.
Answer:
Residual Plot 1: Scatter Plot A, Good fit Residual Plot 2: Scatter Plot B, Good fit (horizontal line) Residual Plot 3: Scatter Plot C, Poor fit