this shows a scatterplot. which equation best fits the data? a y = -\\frac{3}{5}x + 7 b y = -\\frac{5}{3}x +…
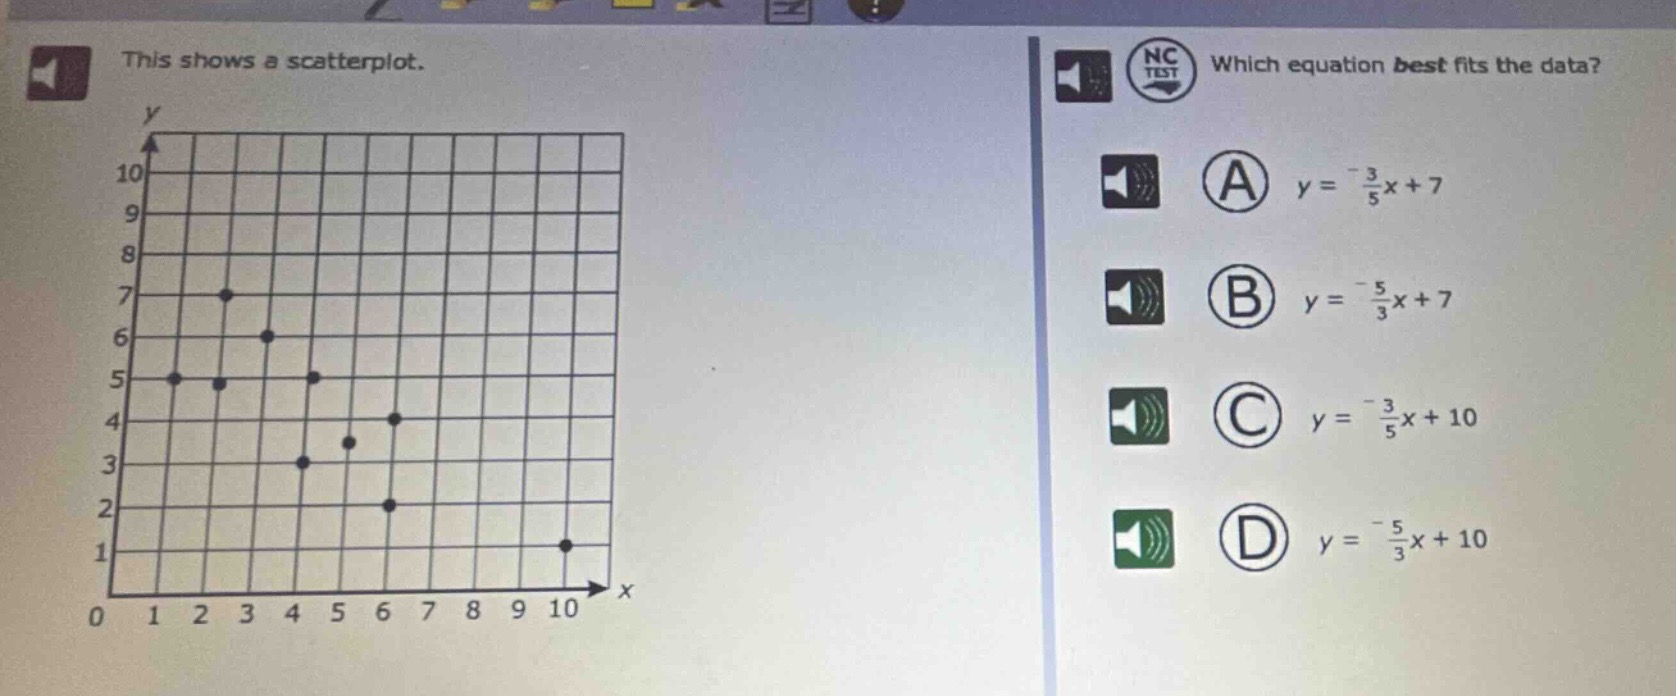
this shows a scatterplot. which equation best fits the data? a y = -\\frac{3}{5}x + 7 b y = -\\frac{5}{3}x + 7 c y = -\\frac{3}{5}x + 10 d y = -\\frac{5}{3}x + 10
Answer
Explanation:
Step1: Estimate the y - intercept
The line seems to cross the y - axis around y = 7. So we can eliminate options C and D which have y - intercepts of 10.
Step2: Estimate the slope
As x increases, y decreases. The slope is negative. To estimate the slope, we can look at two points. For example, if we consider two approximate points (0, 7) and (5, 4). The slope $m=\frac{y_2 - y_1}{x_2 - x_1}=\frac{4 - 7}{5-0}=-\frac{3}{5}$.
Answer:
A. $y =-\frac{3}{5}x + 7$