the side - by - side dotplot below displays the arm spans, in centimeters, for two classes. which statement…
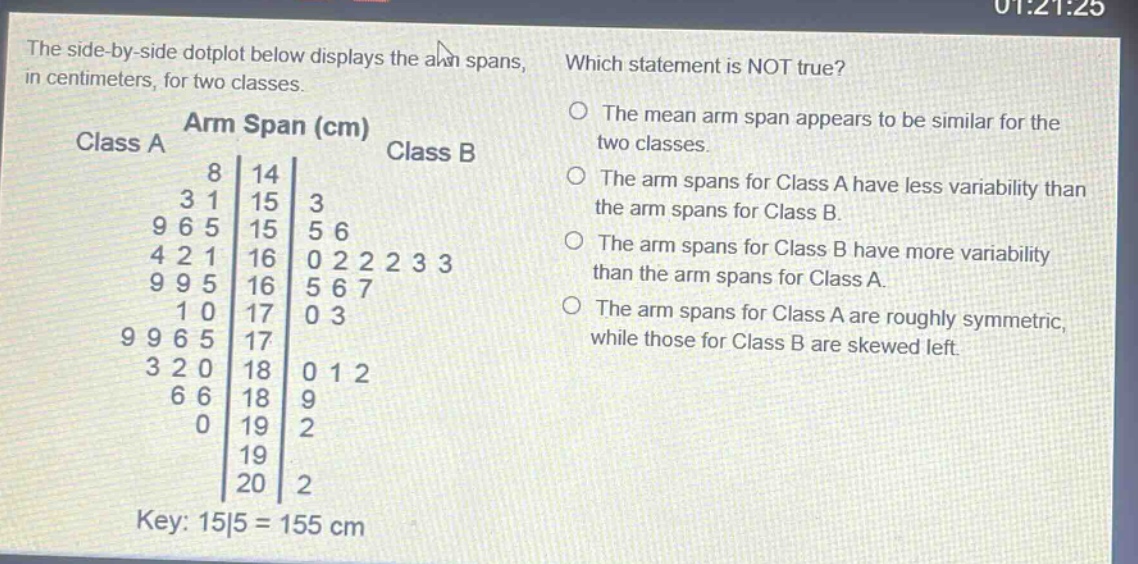
the side - by - side dotplot below displays the arm spans, in centimeters, for two classes. which statement is not true? class a arm span (cm) class b 8 14 3 1 15 3 9 6 5 15 5 6 4 2 1 16 0 2 2 2 3 3 9 9 5 16 5 6 7 1 0 17 0 3 9 9 6 5 17 3 2 0 18 0 1 2 6 6 18 9 0 19 2 19 20 2 key: 15|5 = 155 cm the mean arm span appears to be similar for the two classes. the arm spans for class a have less variability than the arm spans for class b. the arm spans for class b have more variability than the arm spans for class a. the arm spans for class a are roughly symmetric, while those for class b are skewed left.
Answer
Explanation:
Step1: Analyze mean
By observing the dot - plot, the data points for both classes seem to be centered around similar values, so the mean arm span appears to be similar for the two classes.
Step2: Analyze variability
The data points for Class A are more spread out than those for Class B. So, Class A has more variability, not less. Class B has less variability.
Step3: Analyze symmetry and skewness
The distribution of arm - spans for Class A is roughly symmetric as the data is evenly distributed on both sides of the center. The distribution for Class B is skewed left as there are more data points on the right side and a long tail on the left side.
Answer:
The arm spans for Class A have less variability than the arm spans for Class B.