at the silver city middle school field day, a favorite event is the obstacle course. sophie was happy that…
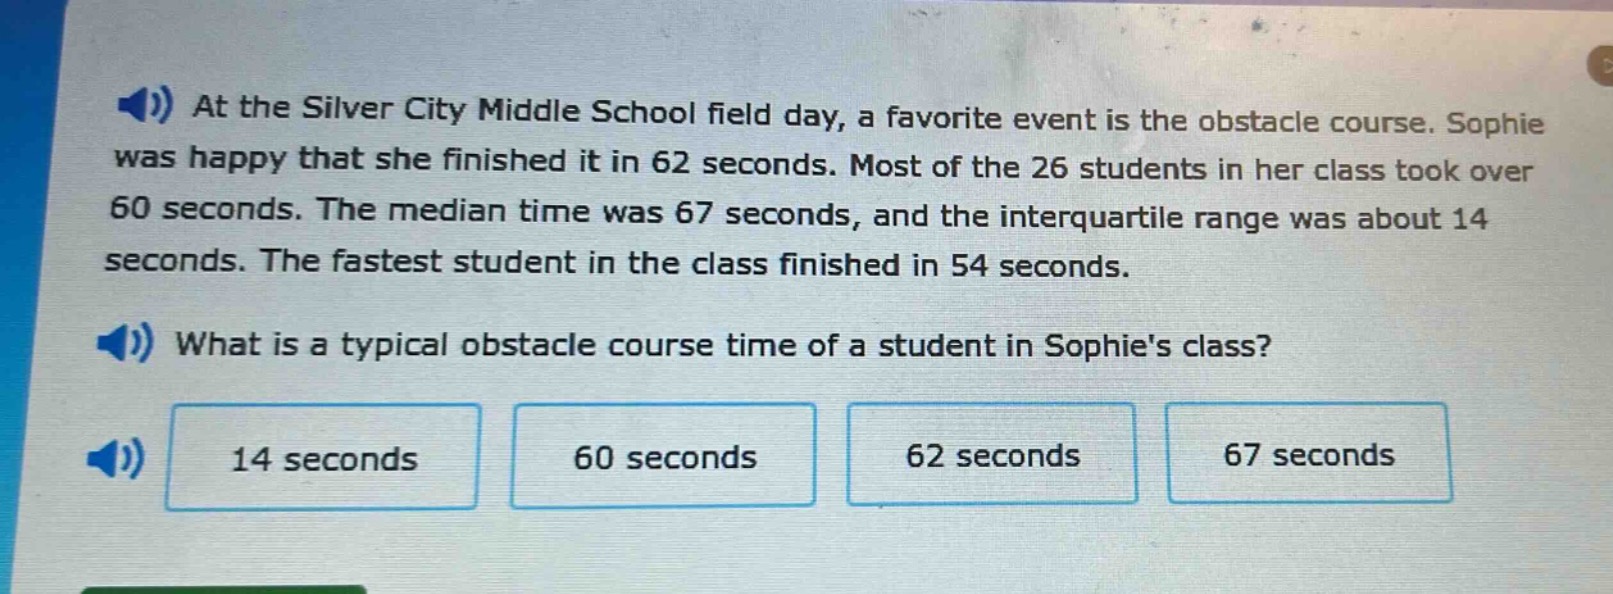
at the silver city middle school field day, a favorite event is the obstacle course. sophie was happy that she finished it in 62 seconds. most of the 26 students in her class took over 60 seconds. the median time was 67 seconds, and the interquartile range was about 14 seconds. the fastest student in the class finished in 54 seconds. what is a typical obstacle course time of a student in sophies class? 14 seconds 60 seconds 62 seconds 67 seconds
Answer
Explanation:
Step1: Understand the concept of median
The median represents the middle - value in a data set. When we want to find a typical value, the median is a good measure as it is not affected as much by extreme values (like the fastest time of 54 seconds here).
Step2: Analyze the given values
We are given that the median time is 67 seconds. The inter - quartile range (14 seconds) is a measure of spread and not a typical value. 60 seconds is just a reference value (most students took over 60 seconds). 62 seconds is Sophie's individual time.
Answer:
67 seconds