six random samples were taken each year for three years. the table shows the inferred population for each…
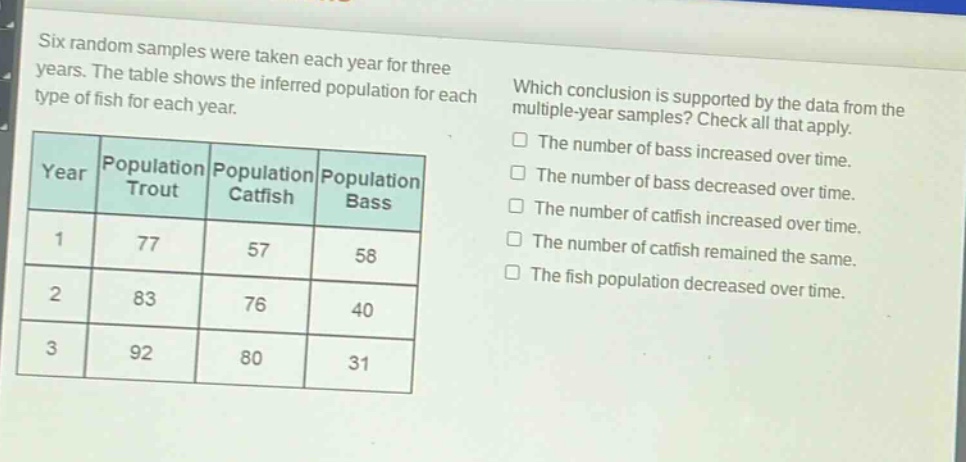
six random samples were taken each year for three years. the table shows the inferred population for each type of fish for each year. which conclusion is supported by the data from the multiple - year samples? check all that apply. the number of bass increased over time. the number of bass decreased over time. the number of catfish increased over time. the number of catfish remained the same. the fish population decreased over time.\n|year|population trout|population catfish|population bass|\n|----|----|----|----|\n|1|77|57|58|\n|2|83|76|40|\n|3|92|80|31|
Answer
Answer:
- The number of bass decreased over time.
- The number of catfish increased over time.
Explanation:
Step1: Analyze bass population
In year 1, bass population is 58. In year 2, it is 40 and in year 3, it is 31. As 58>40>31, the number of bass decreased over time.
Step2: Analyze catfish population
In year 1, catfish population is 57. In year 2, it is 76 and in year 3, it is 80. As 57<76<80, the number of catfish increased over time.
Step3: Analyze trout population
Trout population increased from 77 in year 1 to 83 in year 2 and 92 in year 3, but this is not among the options.
Step4: Analyze overall fish - population
Total fish population in year 1: 77 + 57+58 = 192. In year 2: 83 + 76+40 = 199. In year 3: 92+80 + 31=203. The fish population increased over time, so the option "The fish population decreased over time" is incorrect.