the sixth - grade students at jefferson middle school took a survey for health class. as part of the survey…
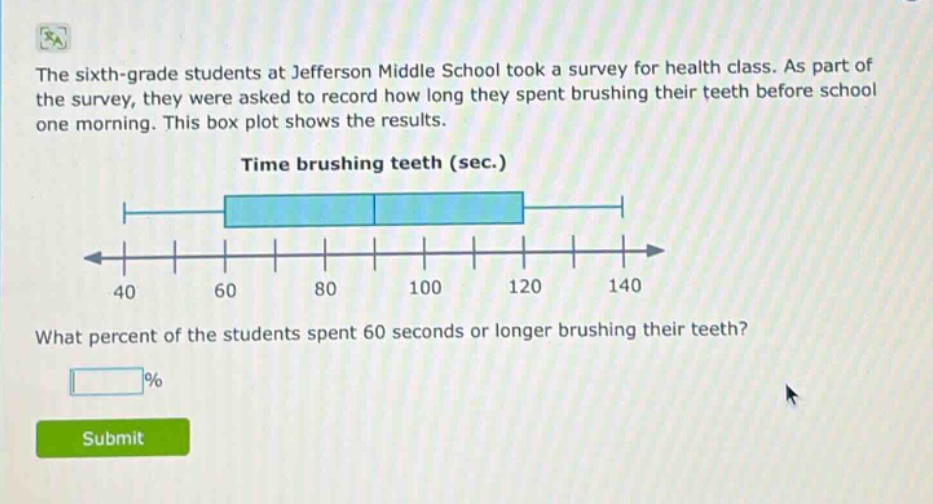
the sixth - grade students at jefferson middle school took a survey for health class. as part of the survey, they were asked to record how long they spent brushing their teeth before school one morning. this box plot shows the results. time brushing teeth (sec.) what percent of the students spent 60 seconds or longer brushing their teeth? %
Answer
Explanation:
Step1: Understand box - plot properties
In a box - plot, the left - most whisker represents the minimum value, the left side of the box represents the first quartile ($Q_1$), the line inside the box represents the median ($Q_2$), the right side of the box represents the third quartile ($Q_3$), and the right - most whisker represents the maximum value. Here, 60 seconds is the first quartile ($Q_1$).
Step2: Calculate the percentage
The first quartile divides the data into 25% below it and 75% above it. So the percentage of students who spent 60 seconds or longer brushing their teeth is 75%.
Answer:
75