the sixth - grade students at madison middle school had a walkathon to raise money for their local hospital…
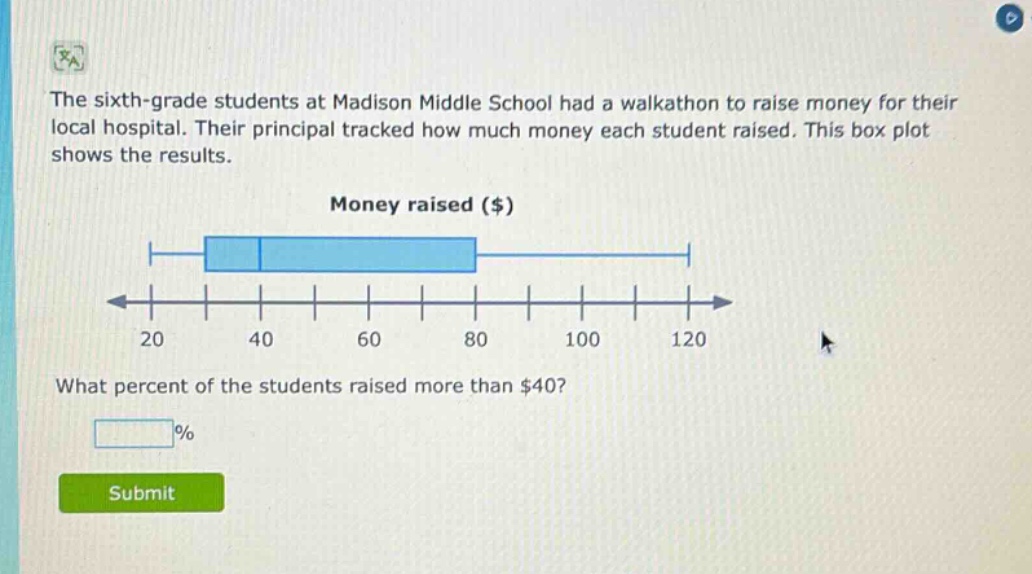
the sixth - grade students at madison middle school had a walkathon to raise money for their local hospital. their principal tracked how much money each student raised. this box plot shows the results. money raised ($) what percent of the students raised more than $40? % submit
Answer
Explanation:
Step1: Understand box - plot quartiles
In a box - plot, the box starts at the first quartile ($Q_1$) and ends at the third quartile ($Q_3$), and the line inside the box is the median. Here, $40$ is the first quartile ($Q_1$).
Step2: Recall quartile percentage relationship
The first quartile represents the 25th percentile of the data. That means 25% of the data lies below $Q_1$.
Step3: Calculate percentage above $Q_1$
The percentage of data above $Q_1$ is $100 - 25=75$.
Answer:
75