a snowstorm hit dane county. a weatherman reported how many inches of snow each city in the area…
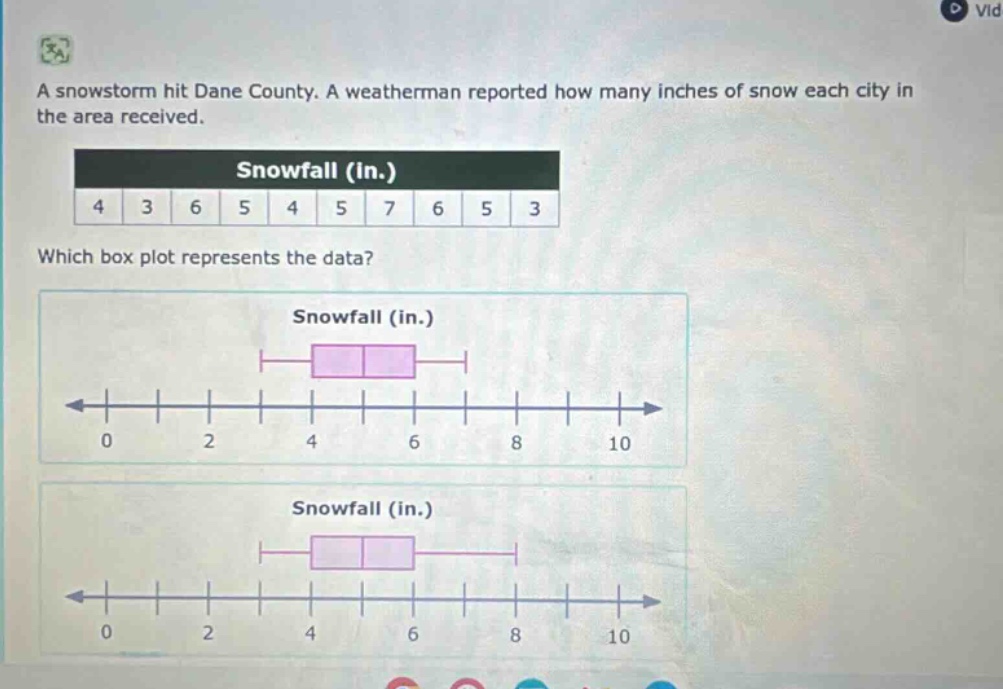
a snowstorm hit dane county. a weatherman reported how many inches of snow each city in the area received.\nsnowfall (in.)\n4 3 6 5 4 5 7 6 5 3\nwhich box plot represents the data?\nsnowfall (in.)\nsnowfall (in.)
Answer
Explanation:
Step1: Arrange data in ascending order
3, 3, 4, 4, 5, 5, 5, 6, 6, 7
Step2: Find the minimum value
The minimum value is 3.
Step3: Find the first - quartile ($Q_1$)
There are 10 data points. The position of $Q_1$ is $\frac{10 + 1}{4}=2.75$. So, $Q_1$ is the value between the 2nd and 3rd ordered data points. $Q_1=\frac{3 + 4}{2}=3.5$.
Step4: Find the median ($Q_2$)
The position of the median is $\frac{10}{2}=5$ (for an even - numbered data set, we take the average of the 5th and 6th ordered data points). $Q_2=\frac{5+5}{2}=5$.
Step5: Find the third - quartile ($Q_3$)
The position of $Q_3$ is $3\times\frac{10 + 1}{4}=8.25$. So, $Q_3$ is the value between the 8th and 9th ordered data points. $Q_3=\frac{6+6}{2}=6$.
Step6: Find the maximum value
The maximum value is 7.
The box - plot should have the left - most whisker starting at 3, the left side of the box at 3.5, the line inside the box at 5, the right side of the box at 6, and the right - most whisker ending at 7.
Answer:
We need to check which of the given box - plots has these values for the minimum, $Q_1$, median, $Q_3$, and maximum. Without seeing the full options clearly, but based on the calculated values, the box - plot with the left whisker starting at 3, box starting around 3.5, median line at 5, box ending at 6 and right whisker ending at 7 is the correct one.