the snowy pines historical center kept track of the amount of snow that fell in their town each year for the…
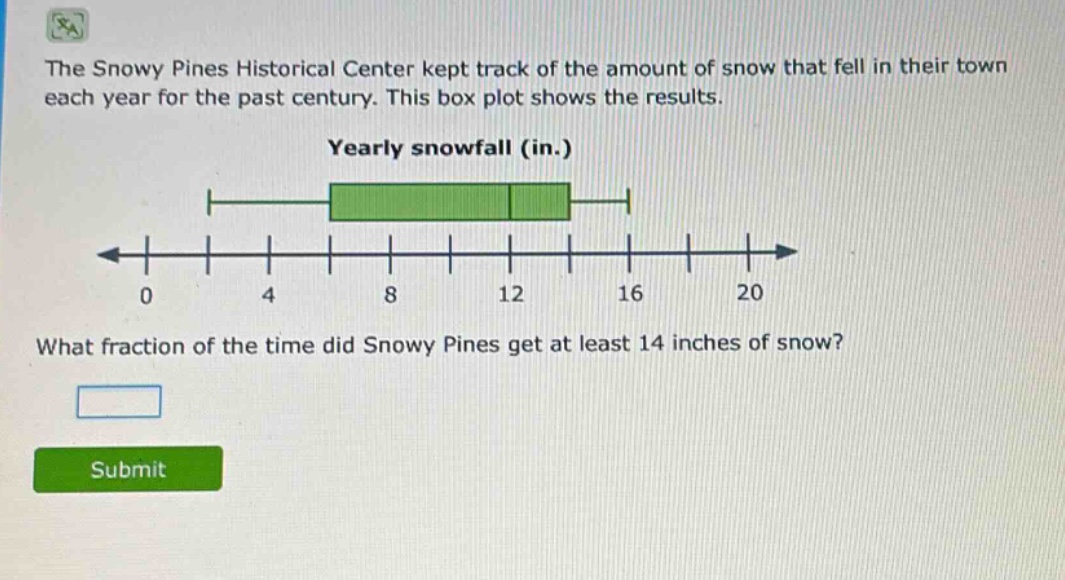
the snowy pines historical center kept track of the amount of snow that fell in their town each year for the past century. this box plot shows the results. yearly snowfall (in.) what fraction of the time did snowy pines get at least 14 inches of snow?
Answer
Explanation:
Step1: Understand box - plot properties
A box - plot divides data into quartiles. The right - hand side of the box represents the third quartile ($Q_3$), and the end of the right - hand whisker represents the maximum value.
Step2: Identify relevant parts of box - plot
In a box - plot, the box is divided into four equal parts (quartiles). The part of the data that is at least 14 inches of snow starts from the third - quartile position (since 14 is at the third - quartile mark in this box - plot).
Step3: Calculate the fraction
The third quartile and above represents the top 25% of the data. As a fraction, 25% is $\frac{1}{4}$.
Answer:
$\frac{1}{4}$