the snowy slopes ski resort kept track of the amount of snow that fell each weekend during their busy…
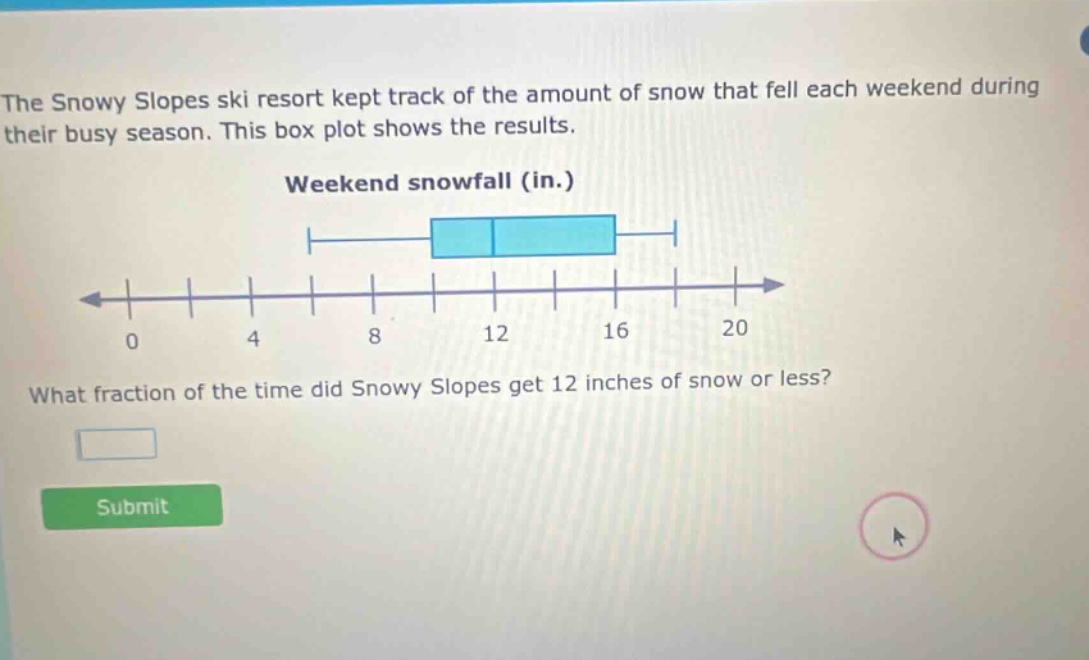
the snowy slopes ski resort kept track of the amount of snow that fell each weekend during their busy season. this box plot shows the results. weekend snowfall (in.) what fraction of the time did snowy slopes get 12 inches of snow or less?
Answer
Explanation:
Step1: Understand box - plot quartiles
In a box - plot, the left - hand side of the box represents the first quartile ($Q_1$), the line inside the box represents the median ($Q_2$), and the right - hand side of the box represents the third quartile ($Q_3$). The whiskers represent the minimum and maximum values.
Step2: Identify the position of 12 inches
The value 12 inches is at the median ($Q_2$) of the box - plot.
Step3: Determine the fraction
The median divides the data set into two equal parts. So, 50% or $\frac{1}{2}$ of the data is at or below the median.
Answer:
$\frac{1}{2}$