sofia is learning to play the trumpet. her teacher asked her to record how long she practices each day…
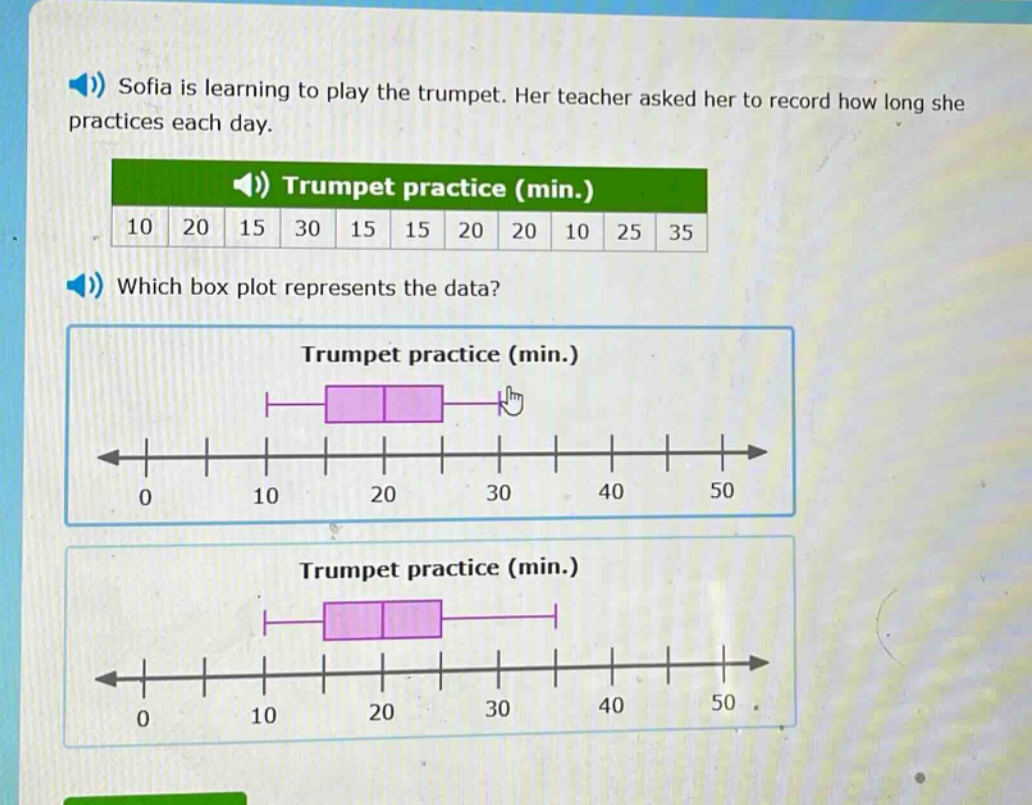
sofia is learning to play the trumpet. her teacher asked her to record how long she practices each day. trumpet practice (min.) 10 20 15 30 15 15 20 20 10 25 35 which box plot represents the data? trumpet practice (min.) trumpet practice (min.)
Answer
Explanation:
Step1: Arrange data in ascending order
10, 10, 15, 15, 15, 20, 20, 20, 25, 30, 35
Step2: Find the median (Q2)
There are 11 data - points. The median is the 6th value. So, Q2 = 20.
Step3: Find the lower half of data
10, 10, 15, 15, 15. The median of the lower half (Q1) is 15.
Step4: Find the upper half of data
20, 20, 25, 30, 35. The median of the upper half (Q3) is 25.
Step5: Find the minimum and maximum
Minimum = 10, Maximum = 35.
In a box - plot, the left - hand side of the box is Q1, the line inside the box is Q2, the right - hand side of the box is Q3, the left whisker extends to the minimum, and the right whisker extends to the maximum.
The box should start at 15, have a line at 20, end at 25, with whiskers extending to 10 and 35.
Answer:
The box - plot where the box starts at 15, has a line inside at 20, ends at 25, and the whiskers extend to 10 and 35 (the second box - plot in the image).