sofia is learning to play the trumpet. her teacher asked her to record how long she practices each…
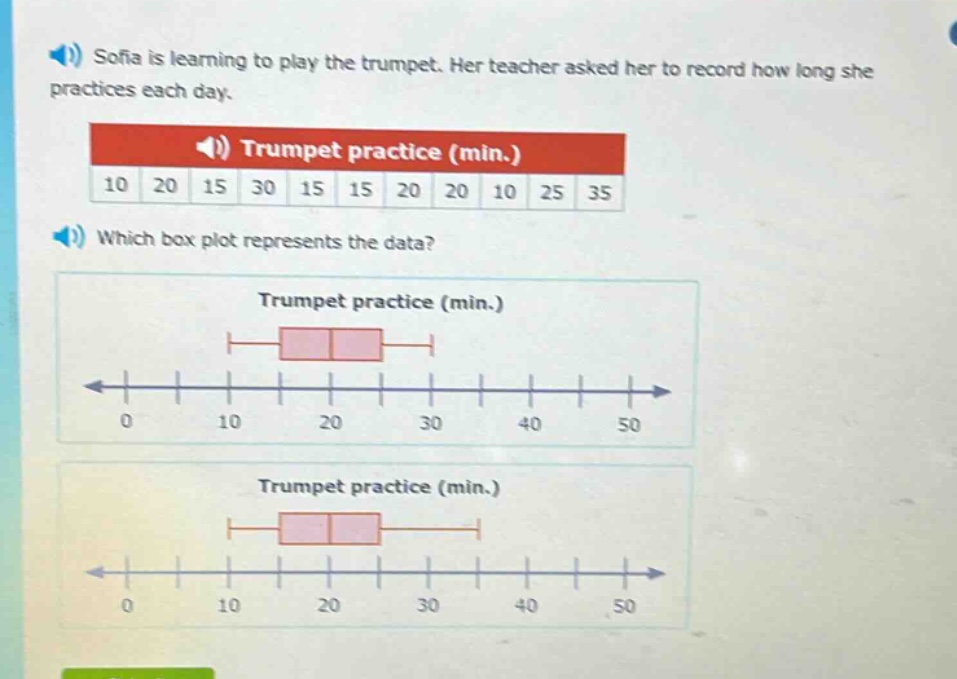
sofia is learning to play the trumpet. her teacher asked her to record how long she practices each day.\ntrumpet practice (min.)\n10 20 15 30 15 15 20 20 10 25 35\nwhich box plot represents the data?\ntrumpet practice (min.)\ntrumpet practice (min.)
Answer
Explanation:
Step1: Arrange data in ascending order
10, 10, 15, 15, 15, 20, 20, 20, 25, 30, 35
Step2: Find the minimum value
The minimum value is 10.
Step3: Find the first - quartile ($Q_1$)
There are 11 data points. The position of $Q_1$ is $\frac{11 + 1}{4}=3$. So $Q_1 = 15$.
Step4: Find the median ($Q_2$)
The position of the median is $\frac{11+1}{2}=6$. So $Q_2 = 20$.
Step5: Find the third - quartile ($Q_3$)
The position of $Q_3$ is $\frac{3(11 + 1)}{4}=9$. So $Q_3 = 25$.
Step6: Find the maximum value
The maximum value is 35.
The box - plot should have the left - most whisker at 10, the left side of the box at 15, the line in the box at 20, the right side of the box at 25, and the right - most whisker at 35.
Answer:
The box - plot that has the left - most whisker at 10, the left side of the box at 15, the line in the box at 20, the right side of the box at 25, and the right - most whisker at 35 represents the data. Without seeing the full options clearly, based on the above calculations, you can identify the correct one among the given box - plots.