what is the spread of the data in the dot plot? number of days it was sunny each week from 0 to 5 from 1 to…
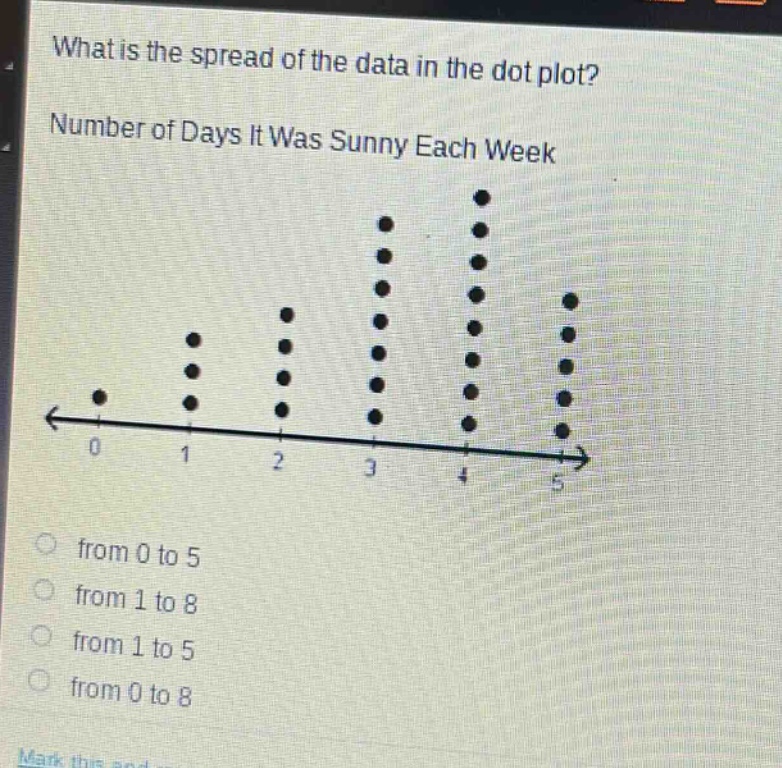
what is the spread of the data in the dot plot? number of days it was sunny each week from 0 to 5 from 1 to 8 from 1 to 5 from 0 to 8
Answer
Explanation:
Step1: Identify min - value
The smallest value on the dot - plot is 0.
Step2: Identify max - value
The largest value on the dot - plot is 5.
Step3: Determine the spread
The spread of data is from the minimum to the maximum value, so it is from 0 to 5.
Answer:
A. from 0 to 5