stacy participated in a summer reading challenge at her local library. she kept track of how long she read…
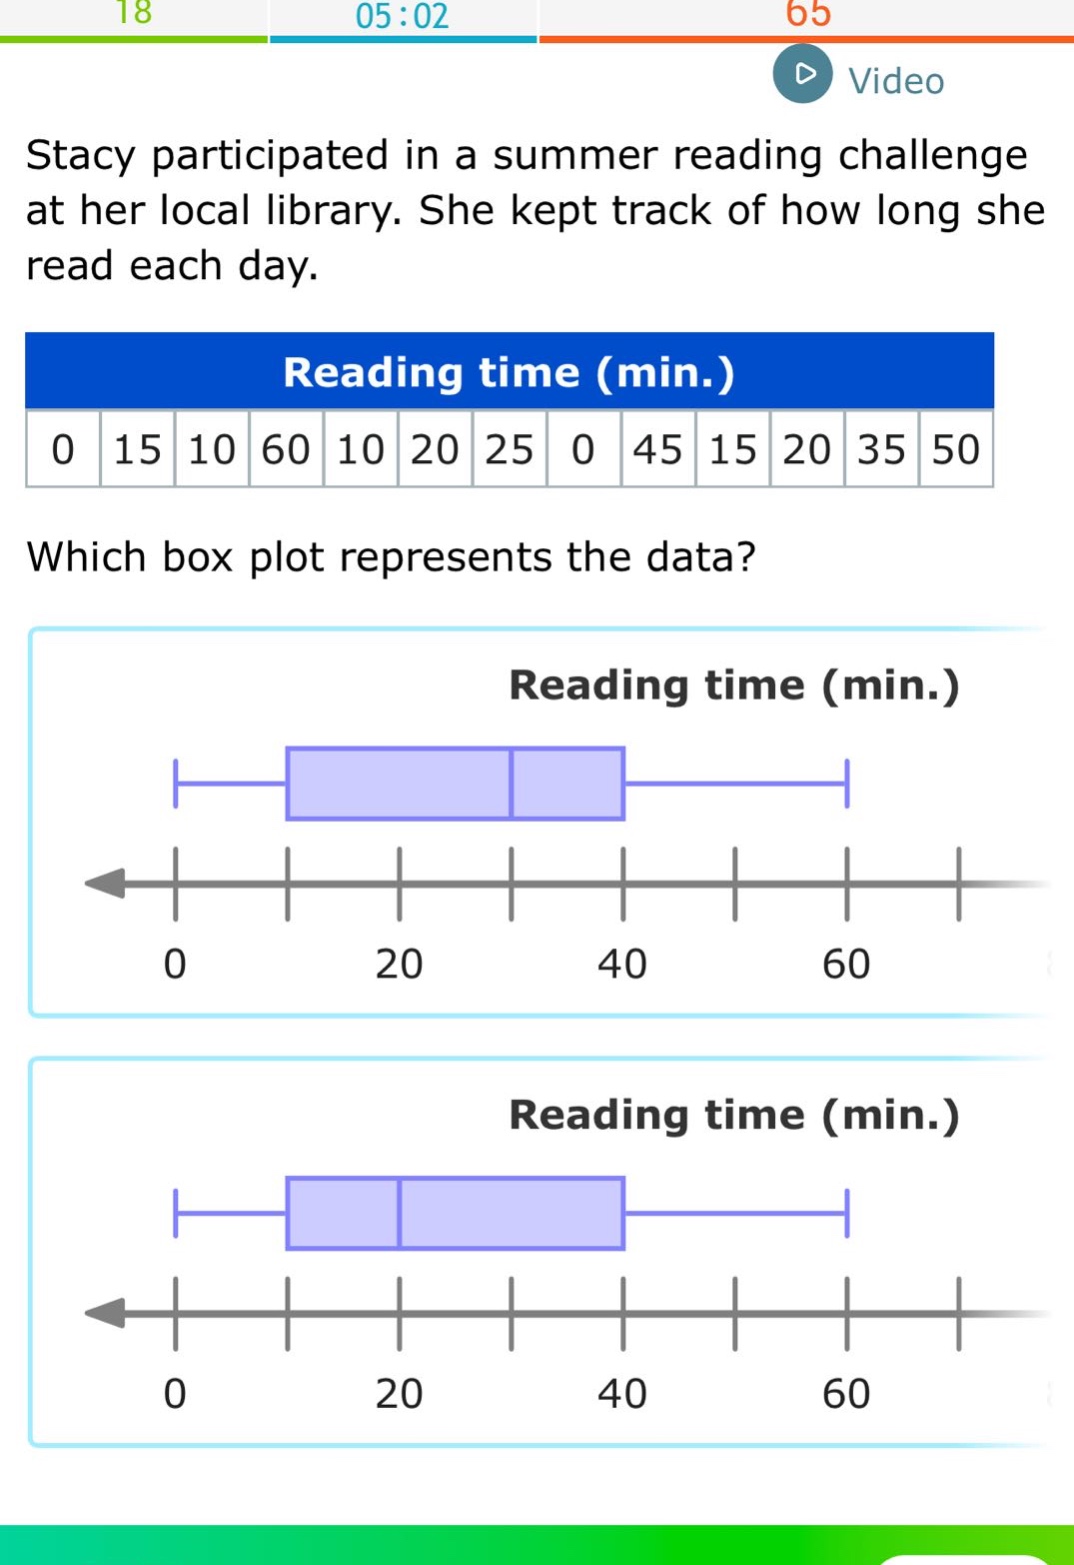
stacy participated in a summer reading challenge at her local library. she kept track of how long she read each day. reading time (min.) 0 15 10 60 10 20 25 0 45 15 20 35 50 which box plot represents the data? reading time (min.) reading time (min.)
Answer
Explanation:
Step1: Arrange data in ascending order
$0,0,10,10,15,15,20,20,25,35,45,50,60$
Step2: Find the median (Q2)
There are $n = 13$ data - points. The median is the $\left(\frac{n + 1}{2}\right)$-th value. $\frac{13+1}{2}=7$ - th value. So, $Q2 = 20$.
Step3: Find the lower half of data
The lower - half of the data is $0,0,10,10,15,15$. The median of the lower - half (Q1) is the $\left(\frac{6}{2}\right)$-th value. Since $\frac{6}{2}=3$, and the average of the 3rd and 4th values (when ordered) is $\frac{10 + 10}{2}=10$. So, $Q1 = 10$.
Step4: Find the upper half of data
The upper - half of the data is $25,35,45,50,60$. The median of the upper - half (Q3) is the $\left(\frac{5+1}{2}\right)$-th value. So, $Q3 = 45$.
Step5: Identify minimum and maximum
The minimum value is $0$ and the maximum value is $60$.
The box - plot should have a box from $Q1 = 10$ to $Q3 = 45$ with a line at the median $Q2 = 20$, and whiskers from $0$ to $60$.
Answer:
We need to visually check which box - plot has a minimum of 0, Q1 at 10, Q2 at 20, Q3 at 45, and a maximum of 60. Without the actual options labeled, we can't give a specific choice, but the correct box - plot should have these characteristics. If we assume the first box - plot has these correct quartile and extreme values, then it is the correct one.