a state randomly questioned some of its high schools about the average percentages of their students who…
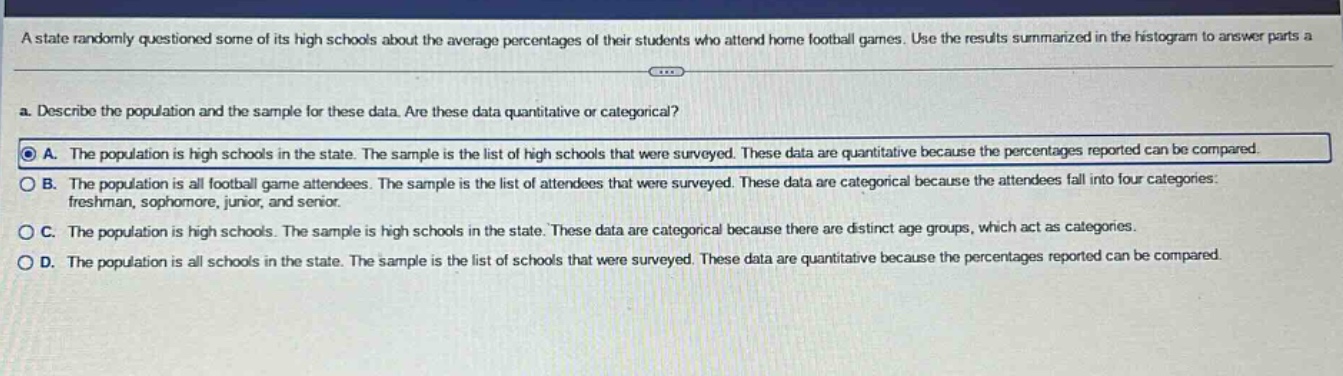
a state randomly questioned some of its high schools about the average percentages of their students who attend home football games. use the results summarized in the histogram to answer parts a. a. describe the population and the sample for these data. are these data quantitative or categorical? a. the population is high schools in the state. the sample is the list of high schools that were surveyed. these data are quantitative because the percentages reported can be compared. b. the population is all football game attendees. the sample is the list of attendees that were surveyed. these data are categorical because the attendees fall into four categories: freshman, sophomore, junior, and senior. c. the population is high schools. the sample is high schools in the state. these data are categorical because there are distinct age groups, which act as categories. d. the population is all schools in the state. the sample is the list of schools that were surveyed. these data are quantitative because the percentages reported can be compared.
Answer
Brief Explanations:
The population is the entire group of interest, which here is high - schools in the state. The sample is the subset of the population that is actually surveyed, so the list of high - schools surveyed. Percentages are numerical values that can be compared, so the data is quantitative.
Answer:
A. The population is high schools in the state. The sample is the list of high schools that were surveyed. These data are quantitative because the percentages reported can be compared.