which statement correctly finds the interquartile range for the set of data represented by the box plot? 14…
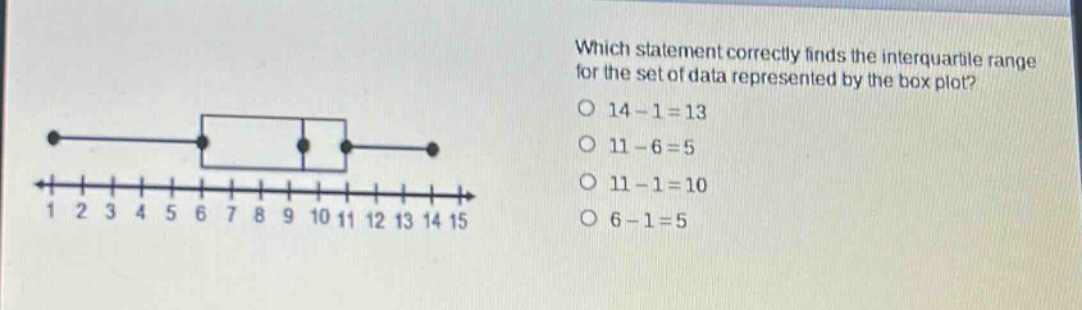
which statement correctly finds the interquartile range for the set of data represented by the box plot? 14 - 1 = 13 11 - 6 = 5 11 - 1 = 10 6 - 1 = 5
Answer
Explanation:
Step1: Recall inter - quartile range formula
The inter - quartile range (IQR) is $Q_3 - Q_1$, where $Q_3$ is the third quartile and $Q_1$ is the first quartile.
Step2: Identify $Q_1$ and $Q_3$ from box - plot
In a box - plot, the left - hand side of the box is $Q_1$ and the right - hand side of the box is $Q_3$. Here, $Q_1 = 6$ and $Q_3=11$.
Step3: Calculate the IQR
$IQR=Q_3 - Q_1=11 - 6$
Answer:
$11 - 6 = 5$