which statement about the data set is true? the mean is greater than the median. the mean is equal to the…
which statement about the data set is true? the mean is greater than the median. the mean is equal to the median. the mean is less than the median. done annual salary number of employees 40 35 30 25 20 15 10 5 0 0 - 19 20 - 39 40 - 59 60 - 79 80 - 99 100 - 119 120 - 139 140 - 159 salary (thousands of dollars)
Answer
Explanation:
Step1: Analyze the shape of the distribution.
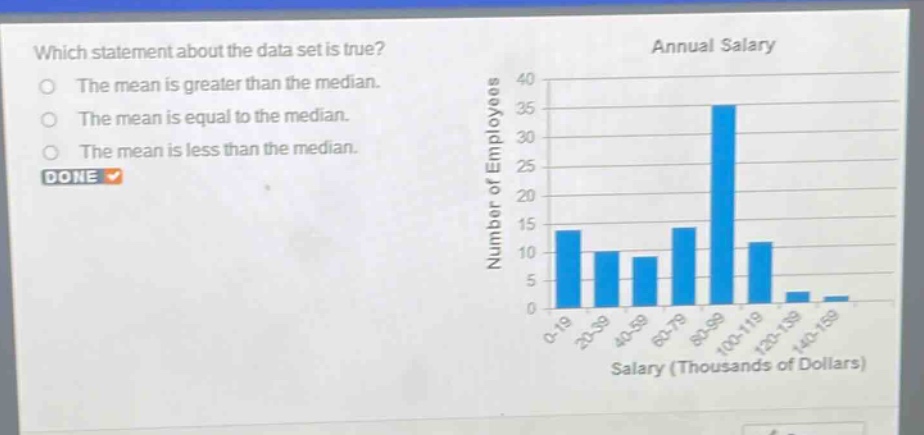
The histogram shows the frequency distribution of annual salaries. Observe the heights of the bars across different salary ranges. The highest frequency occurs in the 80-99 (thousands of dollars) range.
Step2: Determine the skewness of the distribution.
The distribution has a longer tail extending towards the lower salary values (left side). The frequencies for lower salary ranges (0-19, 20-39, 40-59, 60-79) are relatively substantial compared to the frequencies in the ranges above the peak (100-119, 120-139, 140-159). This pattern indicates a left-skewed (negatively skewed) distribution.
Step3: Relate skewness to the mean and median.
For a left-skewed distribution, the mean is typically pulled towards the tail (lower values) and is less than the median. The median is less affected by the extreme lower values compared to the mean.
Answer:
The mean is less than the median.