which statements describe a residual plot for a line of best fit that is a good model for a scatterplot…
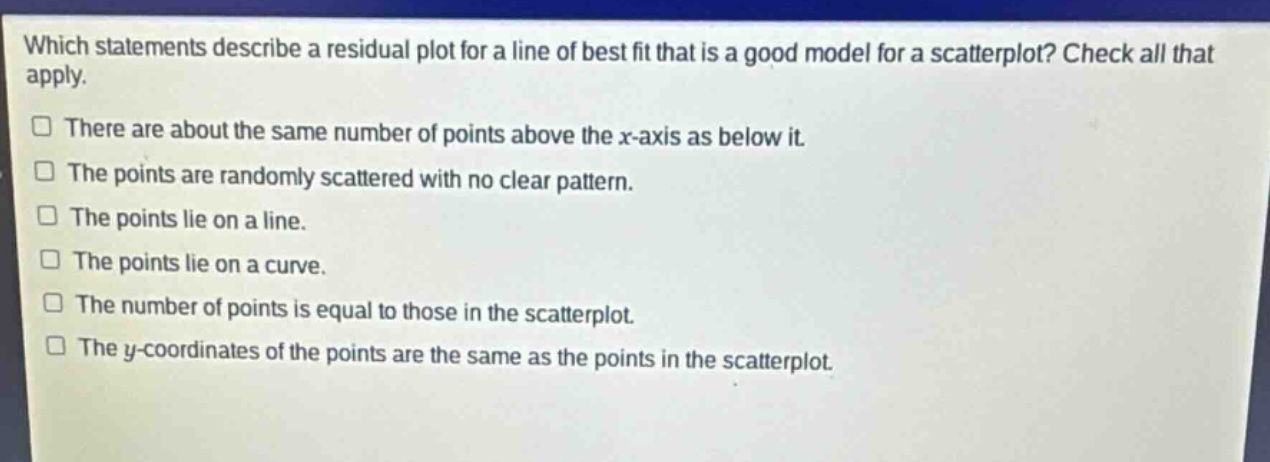
which statements describe a residual plot for a line of best fit that is a good model for a scatterplot? check all that apply.\nthere are about the same number of points above the x - axis as below it.\nthe points are randomly scattered with no clear pattern.\nthe points lie on a line.\nthe points lie on a curve.\nthe number of points is equal to those in the scatterplot.\nthe y - coordinates of the points are the same as the points in the scatterplot.
Answer
Answer:
- There are about the same number of points above the x - axis as below it.
- The points are randomly scattered with no clear pattern.
Brief Explanations:
For a good - fitting line of best fit, residuals (differences between observed and predicted values) should be randomly distributed. Having about equal points above and below the x - axis and random scatter indicate no systematic bias in the model. Points lying on a line or curve in a residual plot suggest a non - linear relationship not captured by the linear model. The number of points and y - coordinates in the residual plot are not criteria for a good fit.