which statements are true about box plots? check all that apply. they help describe sets of data. they…
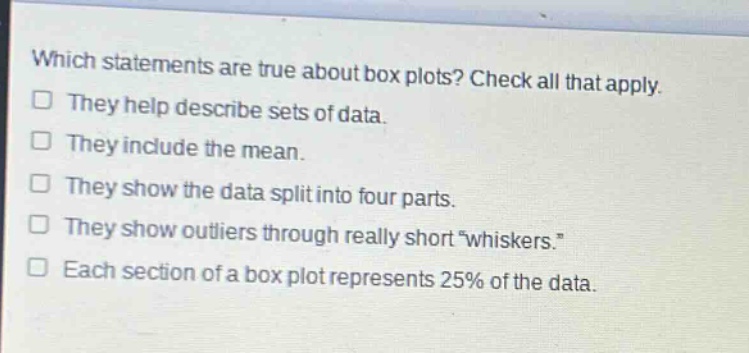
which statements are true about box plots? check all that apply. they help describe sets of data. they include the mean. they show the data split into four parts. they show outliers through really short “whiskers.” each section of a box plot represents 25% of the data.
Answer
Brief Explanations:
Box - plots are used to describe data sets. They split data into four parts (quartiles), and each part represents 25% of the data. They do not include the mean and outliers are shown by points outside the whiskers, not by short whiskers.
Answer:
They help describe sets of data. They show the data split into four parts. Each section of a box - plot represents 25% of the data.