the stem - and - leaf plot below shows the amount of tips received by the servers in a restaurant in one…
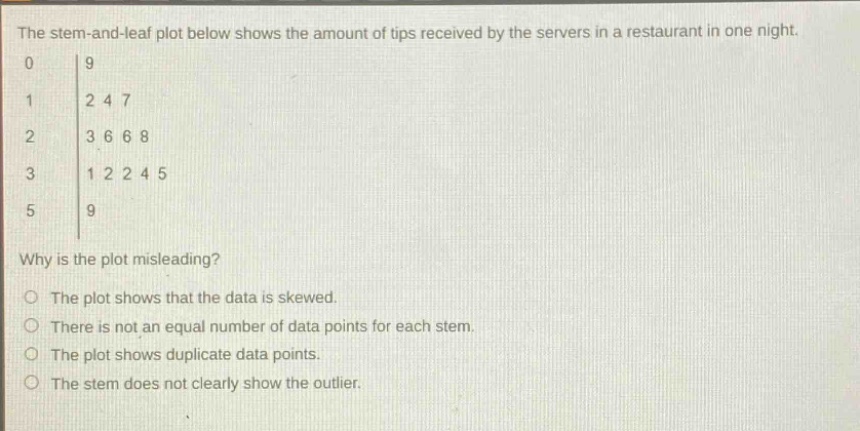
the stem - and - leaf plot below shows the amount of tips received by the servers in a restaurant in one night. 0 | 9 1 | 2 4 7 2 | 3 6 6 8 3 | 1 2 2 4 5 5 | 9 why is the plot misleading? the plot shows that the data is skewed. there is not an equal number of data points for each stem. the plot shows duplicate data points. the stem does not clearly show the outlier.
Answer
Brief Explanations:
In a stem - and - leaf plot, an outlier should be clearly distinguishable. Here, the value 59 is an outlier, but the stem - and - leaf plot structure does not clearly set it apart from the other data points in a way that immediately makes its outlier status obvious. Skewness is not a reason for the plot being misleading in this context. Uneven data points per stem and duplicate data points are normal and not misleading factors.
Answer:
The stem does not clearly show the outlier.