the stem - and - leaf plot below shows the number of pages each student in the class read the previous…
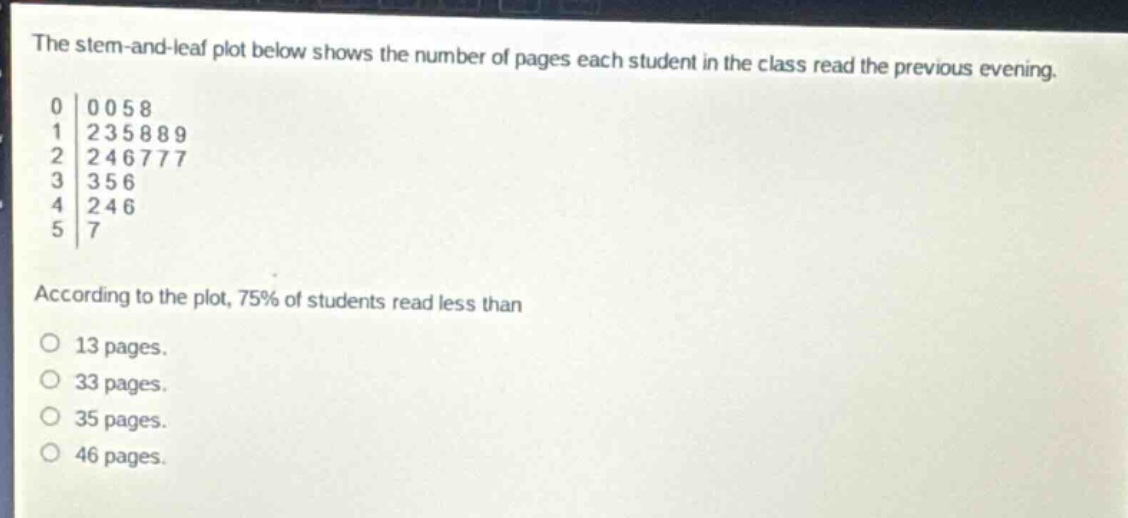
the stem - and - leaf plot below shows the number of pages each student in the class read the previous evening. 0|0058 1|235889 2|246777 3|356 4|246 5|7 according to the plot, 75% of students read less than 13 pages. 33 pages. 35 pages. 46 pages.
Answer
Explanation:
Step1: Count total number of students
Count the number of leaves in the stem - and - leaf plot. There are (4 + 6+5 + 3+3 + 1=22) students.
Step2: Calculate the position of the 75th percentile
Use the formula (n\times p), where (n = 22) and (p = 0.75). So (22\times0.75 = 16.5). Rounding up, we get the 17th - ordered value.
Step3: Order the data from the plot
Order the data values from the stem - and - leaf plot: (0,0,0,5,8,12,13,15,18,18,19,22,24,26,27,27,33,35,36,42,44,46,57).
Step4: Find the 17th value
The 17th value in the ordered list is 35.
Answer:
35 pages.