the stem - and - leaf plot below shows the number of pages each student in a class read the previous…
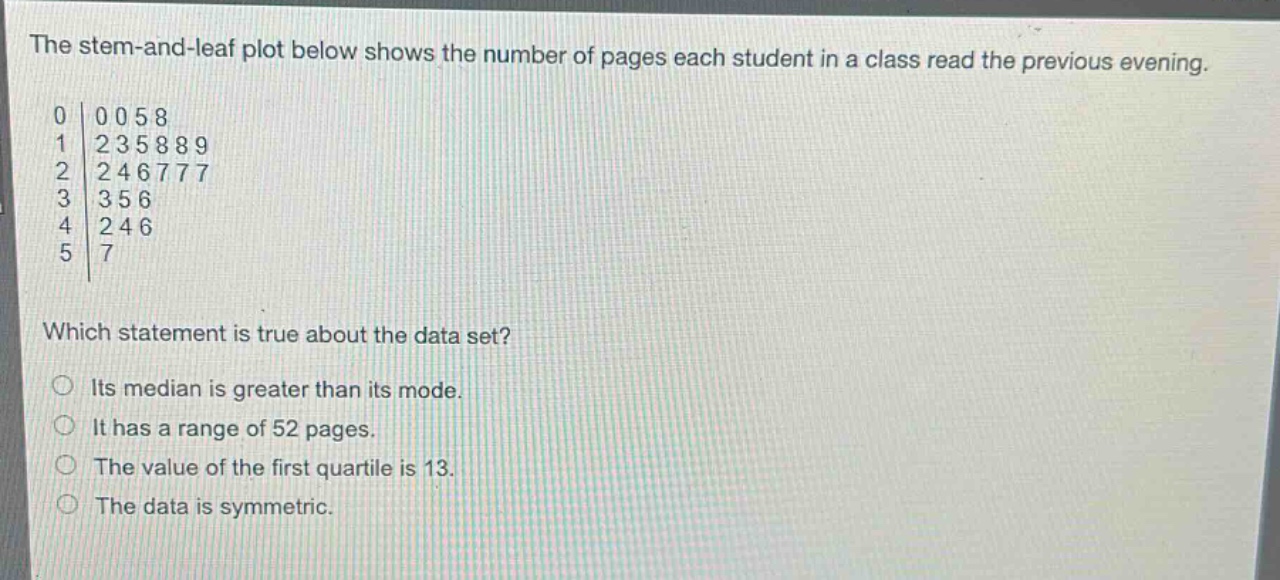
the stem - and - leaf plot below shows the number of pages each student in a class read the previous evening.\n0 | 0 0 5 8\n1 | 2 3 5 8 8 9\n2 | 2 4 6 7 7 7\n3 | 3 5 6\n4 | 2 4 6\n5 | 7\nwhich statement is true about the data set?\nits median is greater than its mode.\nit has a range of 52 pages.\nthe value of the first quartile is 13.\nthe data is symmetric.
Answer
Explanation:
Step1: Write out the data - set
The data - set from the stem - and - leaf plot is: 0, 0, 5, 8, 12, 13, 15, 18, 18, 19, 22, 24, 26, 27, 27, 27, 33, 35, 36, 42, 44, 46, 57. There are (n = 23) data points.
Step2: Find the mode
The mode is the number that appears most frequently. Here, the mode is 27 since it appears 3 times.
Step3: Find the median
Since (n = 23) (an odd number), the median is the (\left(\frac{n + 1}{2}\right))-th value. (\frac{23+1}{2}=12) - th value. Arranging the data in ascending order, the 12 - th value is 24. So the median is 24. Since (24<27), the median is less than the mode.
Step4: Find the range
The range is the difference between the maximum and minimum values. The maximum value is 57 and the minimum value is 0. Range (=57 - 0=57\neq52).
Step5: Find the first quartile
The lower half of the data set has (n_1=\frac{23 - 1}{2}=11) data points. The first quartile (Q_1) is the (\left(\frac{11 + 1}{2}\right))-th value of the lower - half data set. The lower - half data set is 0, 0, 5, 8, 12, 13, 15, 18, 18, 19, 22. The 6 - th value of this set is 13. So (Q_1 = 13).
Step6: Check for symmetry
The data is not symmetric as the distribution of values on the left - hand side and right - hand side of the median is not the same.
Answer:
The value of the first quartile is 13.