the stemplot displays 26 students scores on a 90 - point statistics test. which of the following best…
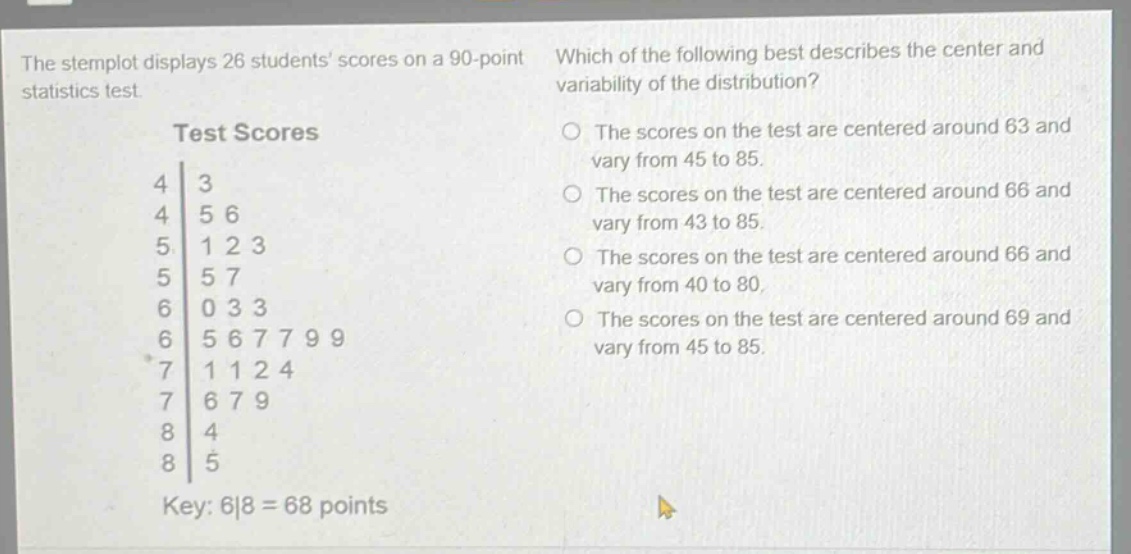
the stemplot displays 26 students scores on a 90 - point statistics test. which of the following best describes the center and variability of the distribution? test scores 4|3 4|5 6 5|1 2 3 5|5 7 6|0 3 3 6|5 6 7 7 9 9 7|1 1 2 4 7|6 7 9 8|4 8|5 key: 6|8 = 68 points the scores on the test are centered around 63 and vary from 45 to 85. the scores on the test are centered around 66 and vary from 43 to 85. the scores on the test are centered around 66 and vary from 40 to 80. the scores on the test are centered around 69 and vary from 45 to 85.
Answer
Explanation:
Step1: Find the minimum score
The minimum score from the stemplot is 43.
Step2: Find the maximum score
The maximum score from the stemplot is 85.
Step3: Calculate the median (center - for odd number of data points, median is the middle - value; for even number of data points, median is the average of the two middle - values). Since there are 26 data points, the median is the average of the 13th and 14th ordered data points. Counting the data points in the stemplot, the 13th and 14th ordered data points are both 66, so the median is 66.
Answer:
The scores on the test are centered around 66 and vary from 43 to 85.