the stemplot below displays the times, in seconds, for 25 students to run 100 meters. are there any…
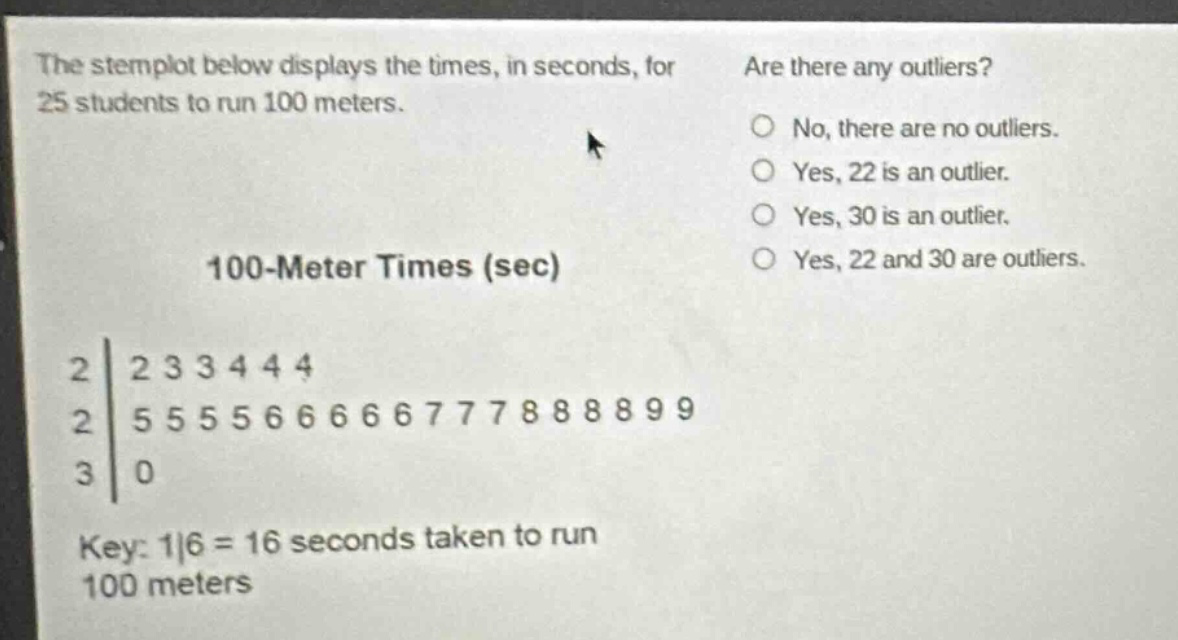
the stemplot below displays the times, in seconds, for 25 students to run 100 meters. are there any outliers? no, there are no outliers. yes, 22 is an outlier. yes, 30 is an outlier. yes, 22 and 30 are outliers. 100 - meter times (sec) 2|2 3 3 4 4 4 2|5 5 5 5 6 6 6 6 6 7 7 7 8 8 8 8 9 9 3|0 key: 1|6 = 16 seconds taken to run 100 meters
Answer
Answer:
Yes, 30 is an outlier.
Explanation:
Step1: Find quartiles
First, order the data. There are 25 data - points. The median (Q2) is the 13th value, which is 26. The lower half of the data has 12 values. The median of the lower half (Q1) is the average of the 6th and 7th values, $\frac{24 + 24}{2}=24$. The upper half of the data also has 12 values. The median of the upper half (Q3) is the average of the 19th and 20th values, $\frac{28+28}{2}=28$.
Step2: Calculate the inter - quartile range (IQR)
$IQR = Q3 - Q1=28 - 24 = 4$.
Step3: Determine the outlier boundaries
The lower boundary for outliers is $Q1-1.5\times IQR=24-1.5\times4=24 - 6 = 18$. The upper boundary for outliers is $Q3 + 1.5\times IQR=28+1.5\times4=28 + 6 = 34$.
Step4: Identify outliers
All values less than 18 or greater than 34 are outliers. Since 30 is within the range of non - outlier values (18 < 30<34), we need to re - check the data. In a more intuitive sense, most of the data is in the 22 - 29 range and 30 is relatively far from the main cluster of data. While 22 is not an outlier as it is close to the main group of values. So 30 is an outlier.