the stemplot below represents the number of bite - size snacks grabbed by 32 students in an activity for a…
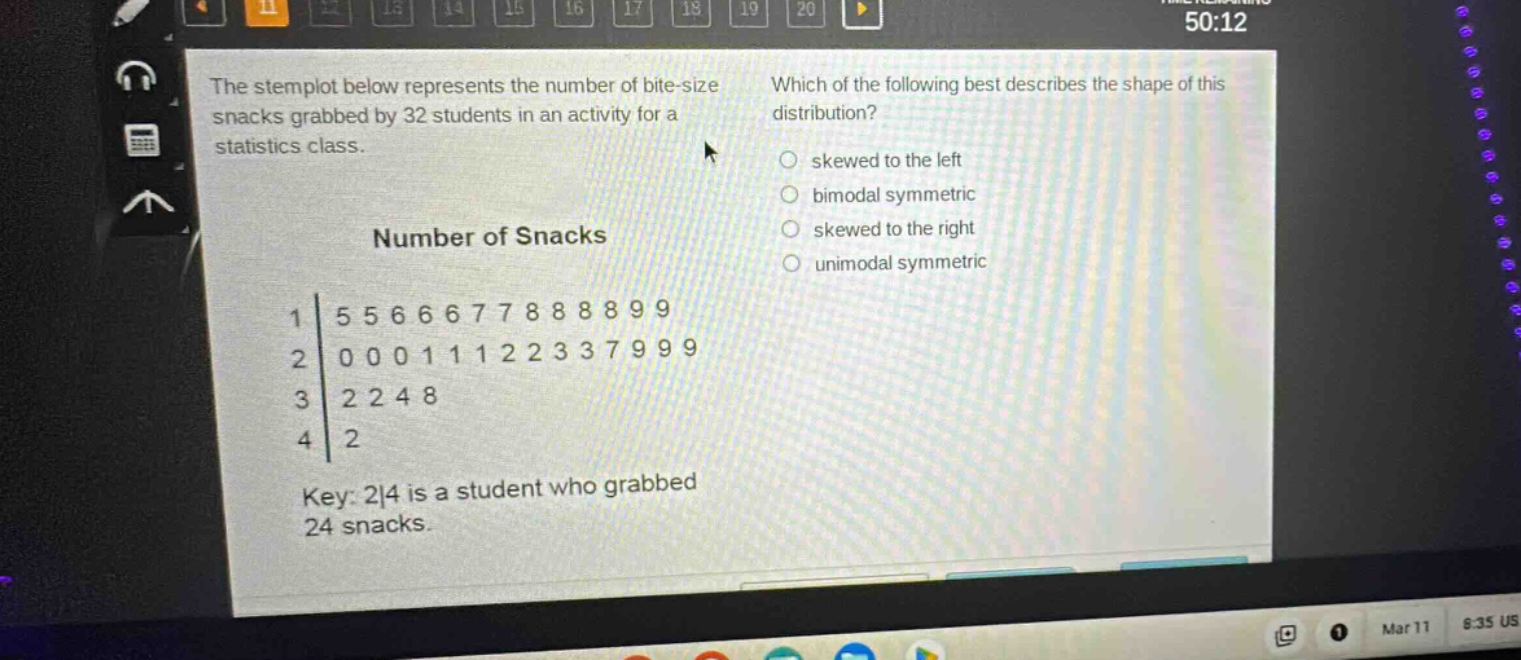
the stemplot below represents the number of bite - size snacks grabbed by 32 students in an activity for a statistics class. which of the following best describes the shape of this distribution? number of snacks 1|5 5 6 6 6 7 7 8 8 8 8 9 9 2|0 0 0 1 1 1 2 2 3 3 7 9 9 9 3|2 2 4 8 4|2 key: 2|4 is a student who grabbed 24 snacks.
Answer
Answer:
skewed to the right
Explanation:
Step1: Observe data distribution
Most data is in lower - value range (10 - 20s), with fewer values in higher - value range (30s and 40s).
Step2: Recall shape definitions
In a right - skewed distribution, the tail is on the right (higher values), which is the case here.