steve determined the number of states each of his friends has visited. number of states visited which…
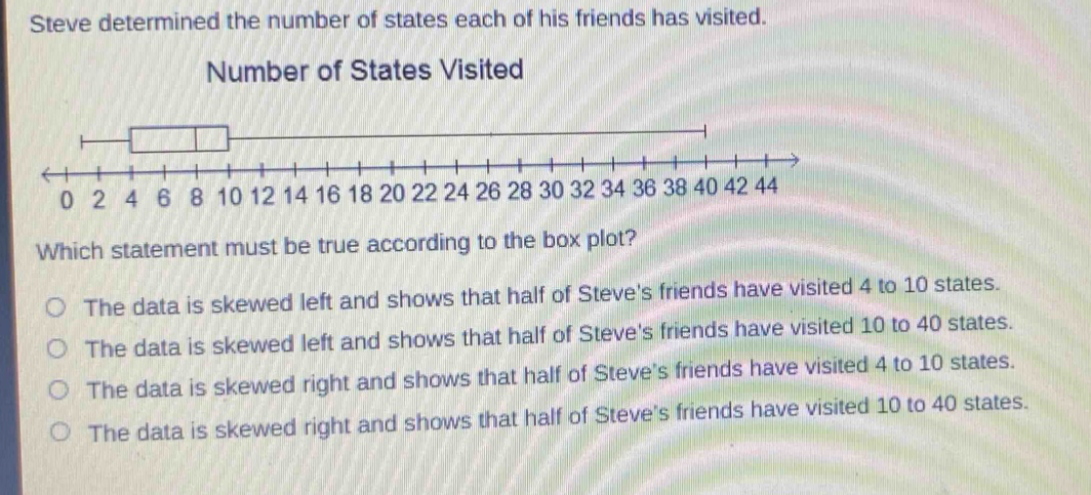
steve determined the number of states each of his friends has visited. number of states visited which statement must be true according to the box - plot? the data is skewed left and shows that half of steves friends have visited 4 to 10 states. the data is skewed left and shows that half of steves friends have visited 10 to 40 states. the data is skewed right and shows that half of steves friends have visited 4 to 10 states. the data is skewed right and shows that half of steves friends have visited 10 to 40 states.
Answer
Answer: The data is skewed right and shows that half of Steve's friends have visited 10 to 40 states.
Explanation:
Step1: Identify skewness
The tail on the right - hand side of the box - plot is longer, so it is skewed right.
Step2: Recall box - plot properties
The box in a box - plot represents the inter - quartile range (IQR), which contains 50% of the data. Here, the box ranges from 10 to 40, meaning half of the data (half of Steve's friends) have visited 10 to 40 states.