which straight line best fits the data for the scatter plot?
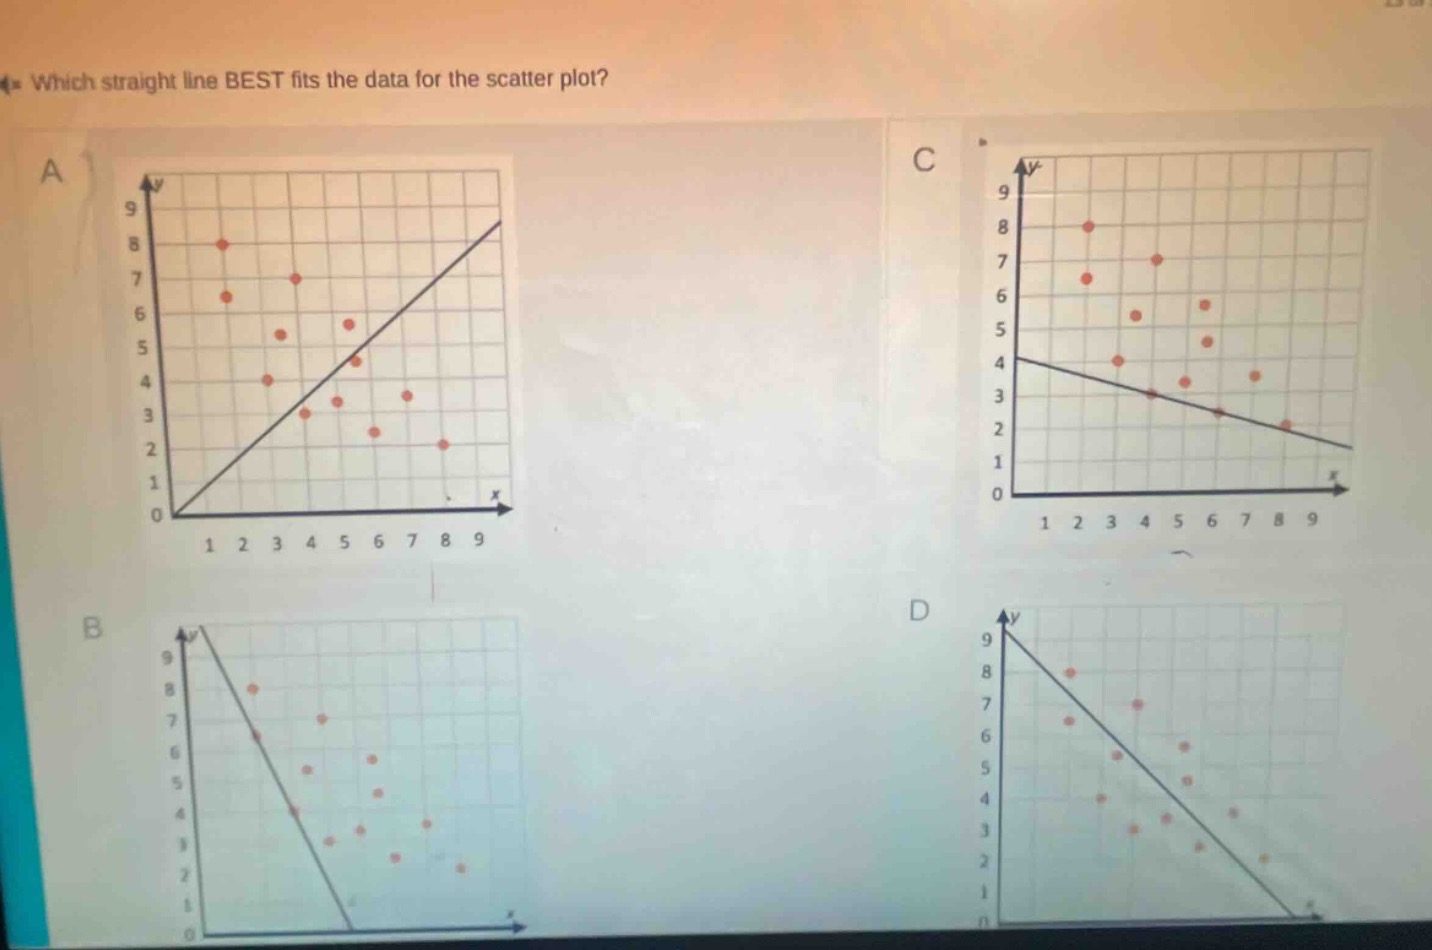
which straight line best fits the data for the scatter plot?
Answer
Explanation:
Step1: Observe data trend
In a best - fit line for a scatter - plot, the line should follow the general trend of the data points. If the data points show an upward trend (as (x) increases, (y) generally increases), the slope of the best - fit line is positive. If the data points show a downward trend (as (x) increases, (y) generally decreases), the slope of the best - fit line is negative.
Step2: Analyze each option
In option A, the line has a positive slope and seems to pass through the general cluster of data points that are trending upwards. In option B, the line has a negative slope but the data doesn't seem to have a strong negative linear trend. In option C, the line has a negative slope and the data doesn't follow it well. In option D, the line has a negative slope and the data doesn't match its trend.
Answer:
A.