here, again, are the student enrollment data you saw in the warm - up. this scatterplot shows correlation. a…
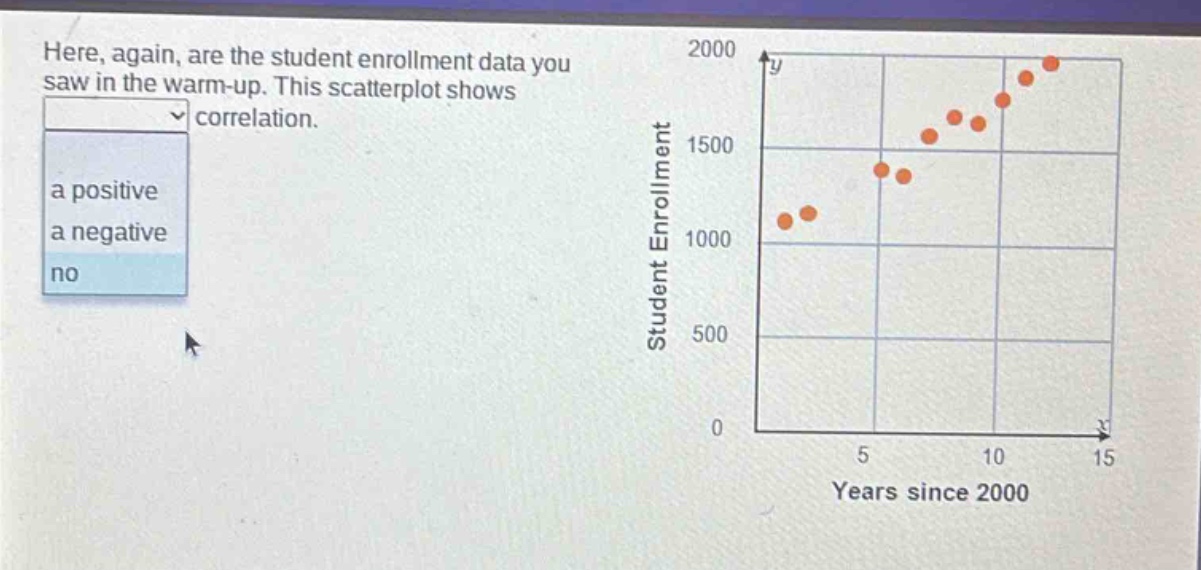
here, again, are the student enrollment data you saw in the warm - up. this scatterplot shows correlation. a positive a negative no
Answer
Answer:
a positive
Explanation:
Step1: Observe scatter - plot trend
As the years since 2000 (x - axis) increase, the student enrollment (y - axis) generally increases.
Step2: Determine correlation type
An upward - sloping trend in a scatter - plot indicates a positive correlation.