here, again, are the student enrollment data you saw in the warm - up. this scatterplot shows a positive…
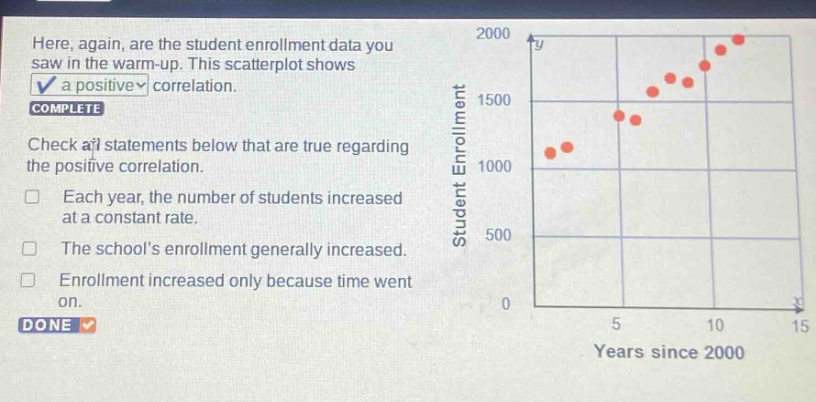
here, again, are the student enrollment data you saw in the warm - up. this scatterplot shows a positive correlation. complete check all statements below that are true regarding the positive correlation. each year, the number of students increased at a constant rate. the schools enrollment generally increased. enrollment increased only because time went on. done
Answer
Brief Explanations:
- The points do not lie on a straight - line, so the number of students did not increase at a constant rate.
- As the years since 2000 increase, the student enrollment generally goes up, indicating a general increase in enrollment.
- There could be multiple factors for the increase in enrollment, not just the passage of time.
Answer:
The school's enrollment generally increased.