a student at a large high school wants to estimate the number of texts seniors send, on average, each day…
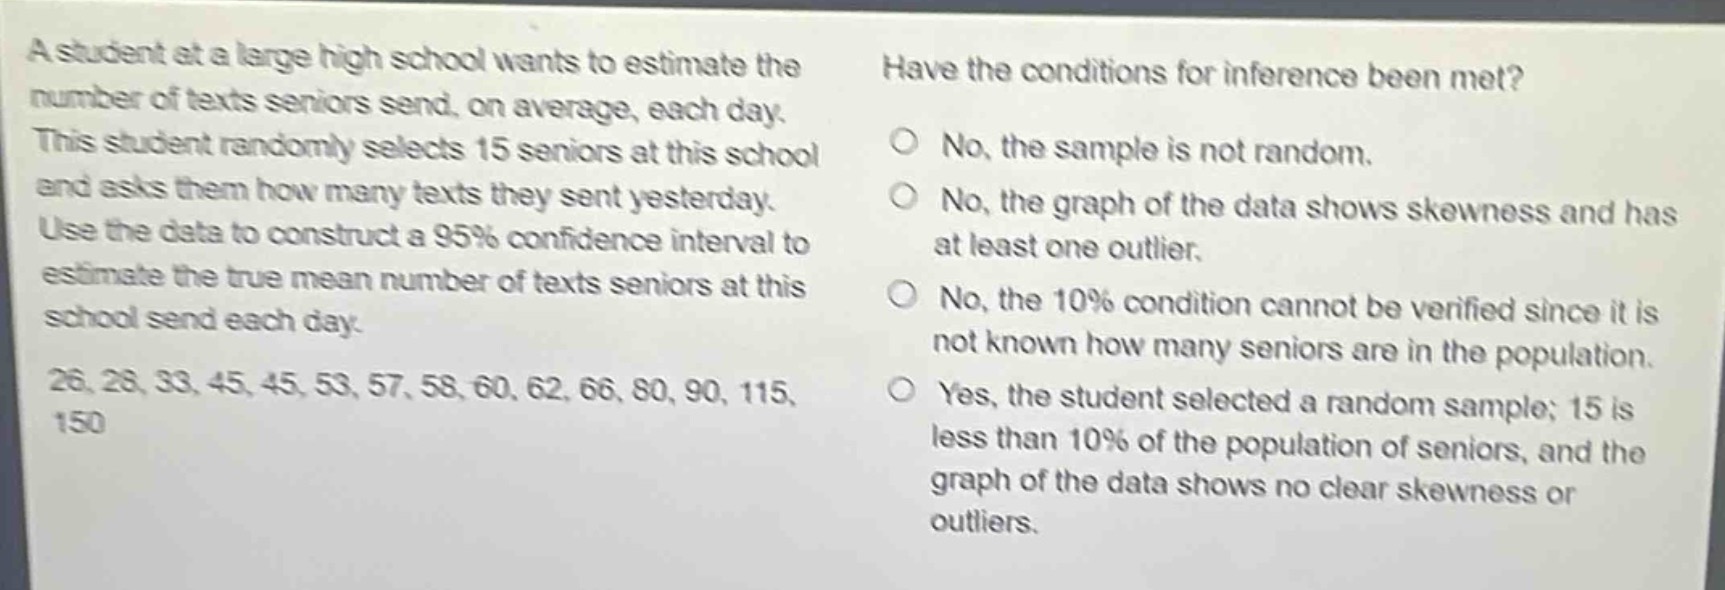
a student at a large high school wants to estimate the number of texts seniors send, on average, each day. this student randomly selects 15 seniors at this school and asks them how many texts they sent yesterday. use the data to construct a 95% confidence interval to estimate the true mean number of texts seniors at this school send each day. 26, 28, 33, 45, 45, 53, 57, 58, 60, 62, 66, 80, 90, 115, 150 have the conditions for inference been met? no, the sample is not random. no, the graph of the data shows skewness and has at least one outlier. no, the 10% condition cannot be verified since it is not known how many seniors are in the population. yes, the student selected a random sample; 15 is less than 10% of the population of seniors, and the graph of the data shows no clear skewness or outliers.
Answer
Explanation:
Step1: Check random - sample condition
The student randomly selects 15 seniors, so the random - sample condition is met.
Step2: Check 10% condition
We don't know the total number of seniors in the population. For the 10% condition, the sample size (n = 15) should be less than 10% of the population size (N) (i.e., (n<0.1N)). Since we don't know (N), we cannot verify if (15<0.1N).
Step3: Check normality condition
We are not given any information about the graph of the data in terms of skewness and outliers in the problem - solving steps, but we focus on the non - verifiable 10% condition.
Answer:
No, the 10% condition cannot be verified since it is not known how many seniors are in the population.