the students in a class collected data on the number of minutes some of them spend brushing their teeth…
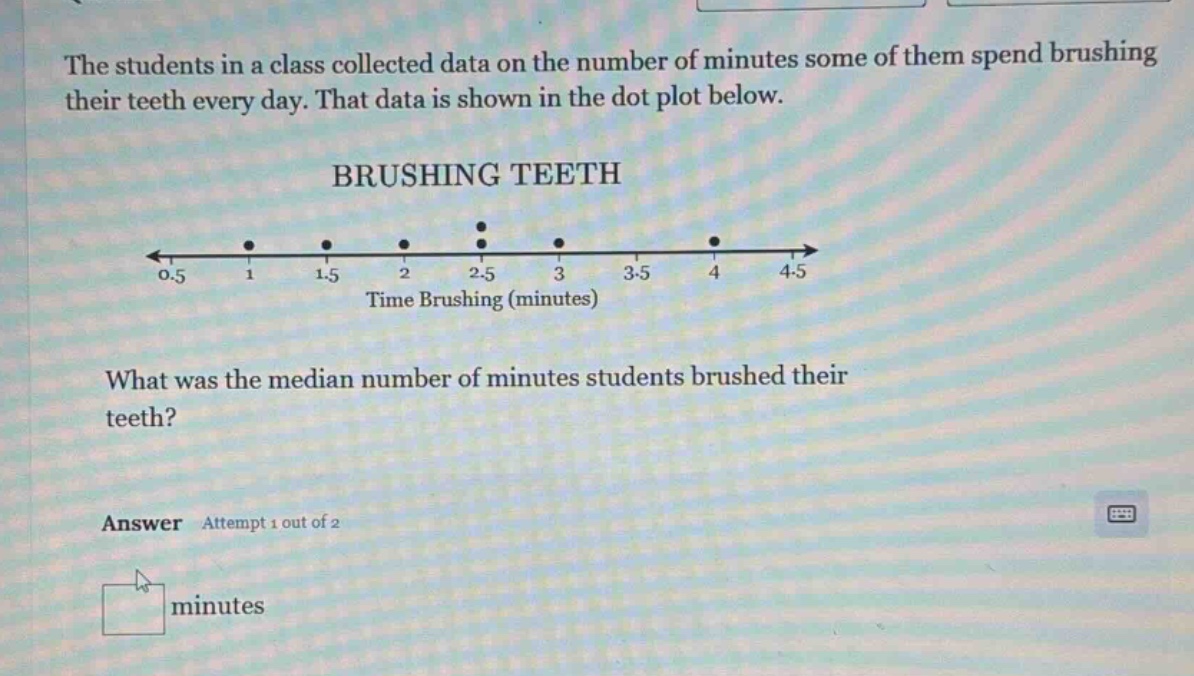
the students in a class collected data on the number of minutes some of them spend brushing their teeth every day. that data is shown in the dot plot below. brushing teeth what was the median number of minutes students brushed their teeth? answer attempt 1 out of 2 minutes
Answer
Explanation:
Step1: Count the number of data - points
There are 7 data - points (dots) on the dot - plot.
Step2: Arrange the data in ascending order
The data values are 1, 1.5, 2, 2.5, 2.5, 3, 4.
Step3: Find the median
For a set of (n = 7) (odd number of) data - points, the median is the (\left(\frac{n + 1}{2}\right))-th value. (\frac{7+1}{2}=4)-th value. The 4 - th value in the ordered list is 2.5.
Answer:
2.5