the students in a class collected data on the number of minutes some of them spend brushing their teeth…
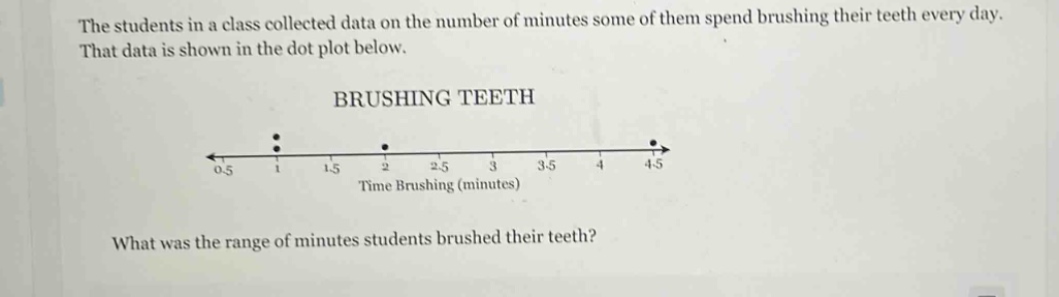
the students in a class collected data on the number of minutes some of them spend brushing their teeth every day. that data is shown in the dot plot below.\nbrushing teeth\nwhat was the range of minutes students brushed their teeth?
Answer
Explanation:
Step1: Identify maximum value
The maximum value from the dot - plot is 4.5 minutes.
Step2: Identify minimum value
The minimum value from the dot - plot is 1 minute.
Step3: Calculate the range
The range is calculated by subtracting the minimum value from the maximum value. So, range = 4.5 - 1. $4.5−1 = 3.5$
Answer:
3.5