the students in a class collected data on the number of minutes some of them spend brushing their teeth…
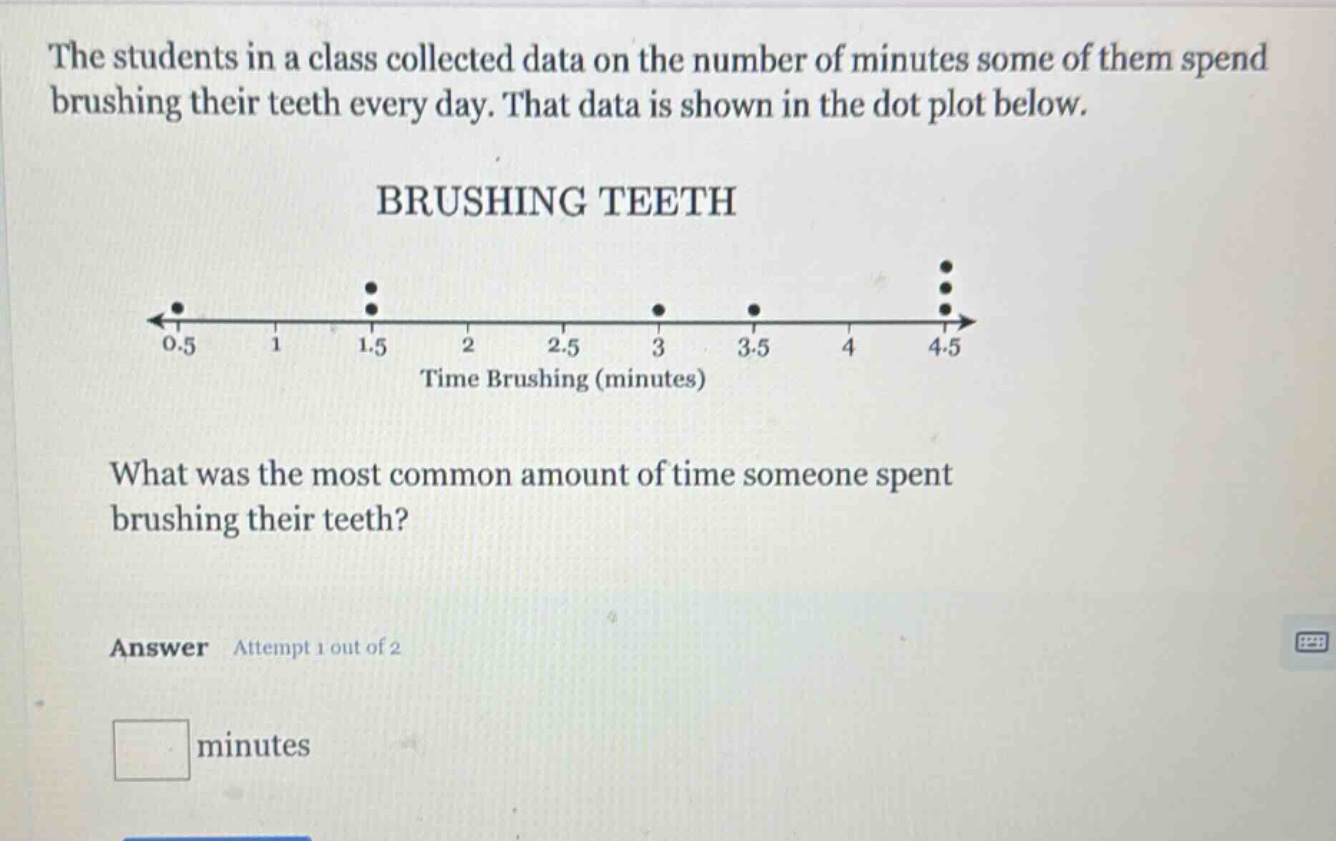
the students in a class collected data on the number of minutes some of them spend brushing their teeth every day. that data is shown in the dot plot below. brushing teeth what was the most common amount of time someone spent brushing their teeth? answer attempt 1 out of 2 minutes
Answer
Explanation:
Step1: Identify mode on dot - plot
The mode is the most frequently occurring value. On a dot - plot, it is the value with the most dots above it.
Step2: Locate the value
We see that the value of 4.5 minutes has 3 dots above it, which is more than the number of dots above any other value.
Answer:
4.5