the students in marlys math class recorded the dimensions of their bedrooms in a frequency table.\nbedroom…
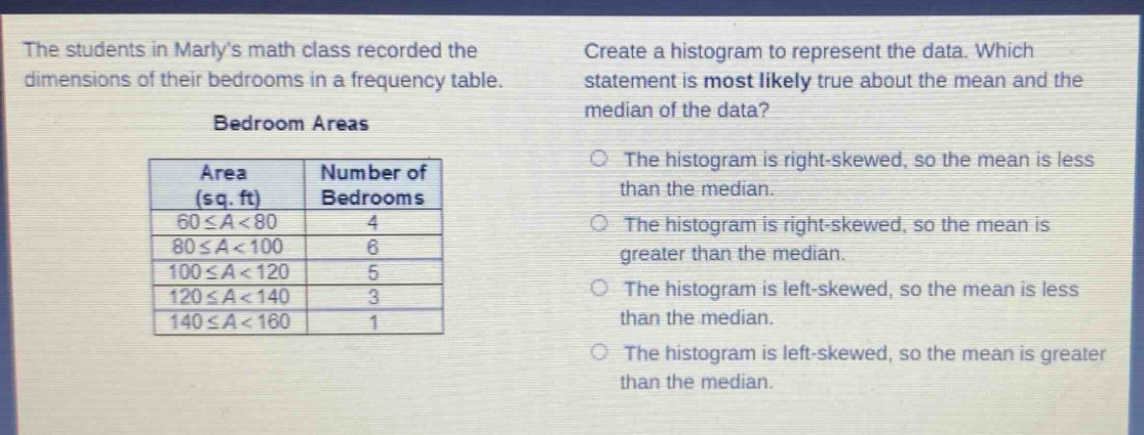
the students in marlys math class recorded the dimensions of their bedrooms in a frequency table.\nbedroom areas\n| area (sq. ft) | number of bedrooms |\n| ---- | ---- |\n| 60 ≤ a < 80 | 4 |\n| 80 ≤ a < 100 | 6 |\n| 100 ≤ a < 120 | 5 |\n| 120 ≤ a < 140 | 3 |\n| 140 ≤ a < 160 | 1 |\ncreate a histogram to represent the data. which statement is most likely true about the mean and the median of the data?\nthe histogram is right - skewed, so the mean is less than the median.\nthe histogram is right - skewed, so the mean is greater than the median.\nthe histogram is left - skewed, so the mean is less than the median.\nthe histogram is left - skewed, so the mean is greater than the median.
Answer
Answer:
The histogram is right - skewed, so the mean is greater than the median.
Explanation:
Step1: Analyze frequency distribution
As area increases, frequency decreases.
Step2: Determine skewness
This indicates right - skewness.
Step3: Recall property of skewed data
In right - skewed data, mean > median.