students play a memory game. they look at a photo of common objects for 30 seconds. then the photo is…
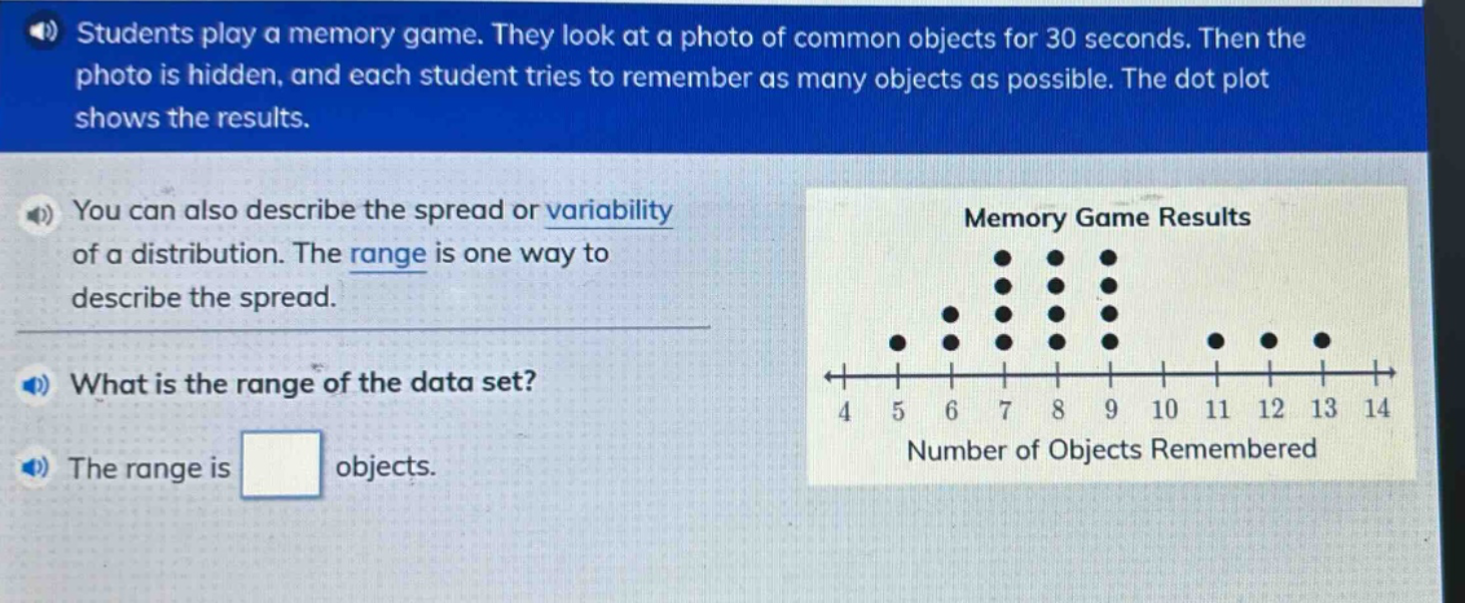
students play a memory game. they look at a photo of common objects for 30 seconds. then the photo is hidden, and each student tries to remember as many objects as possible. the dot - plot shows the results. you can also describe the spread or variability of a distribution. the range is one way to describe the spread. what is the range of the data set? the range is objects.
Answer
Explanation:
Step1: Identify maximum value
The maximum value in the data - set from the dot - plot is 13.
Step2: Identify minimum value
The minimum value in the data - set from the dot - plot is 5.
Step3: Calculate the range
The formula for the range of a data - set is $Range = Maximum - Minimum$. So, $Range=13 - 5$. $13-5 = 8$
Answer:
8