students play a memory game. they look at a photo of common objects for 30 seconds. then the photo is…
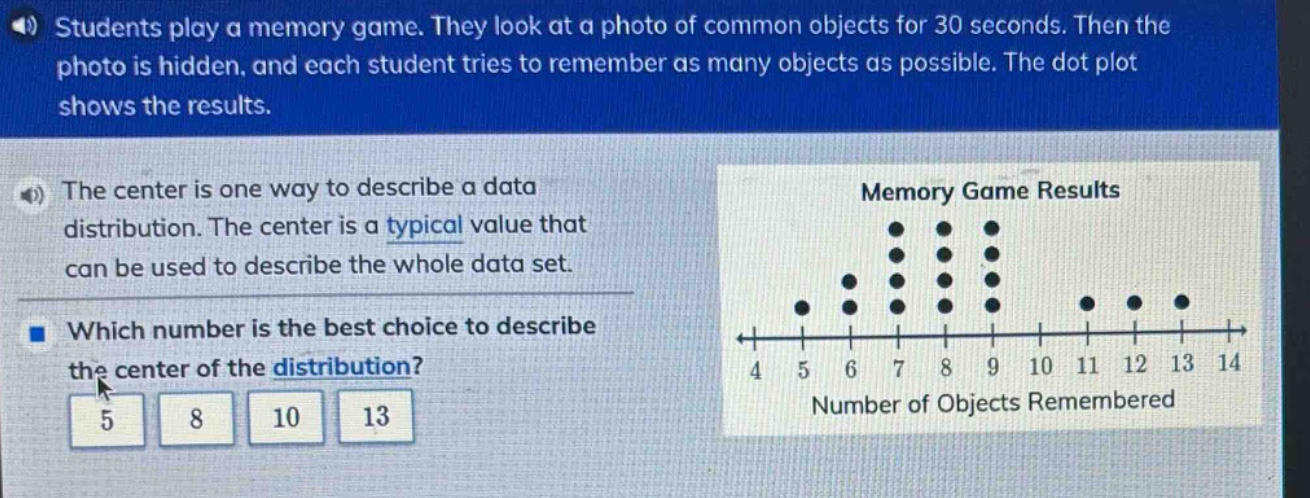
students play a memory game. they look at a photo of common objects for 30 seconds. then the photo is hidden, and each student tries to remember as many objects as possible. the dot - plot shows the results. the center is one way to describe a data distribution. the center is a typical value that can be used to describe the whole data set. which number is the best choice to describe the center of the distribution? 5 8 10 13 memory game results 4 5 6 7 8 9 10 11 12 13 14 number of objects remembered
Answer
Explanation:
Step1: Identify the mode
The mode is the most - frequently occurring value in a data set. In the dot - plot, the number 8 has the most dots above it.
Step2: Recall the concept of center
The mode is a measure of the center of a data distribution. It represents a typical value.
Answer:
8