students from school a and school b were asked whether they watch tv or use the internet after finishing…
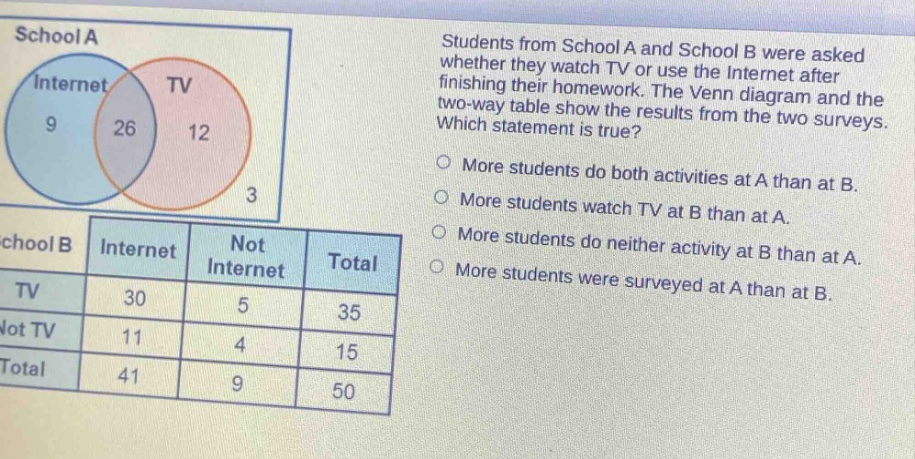
students from school a and school b were asked whether they watch tv or use the internet after finishing their homework. the venn diagram and the two - way table show the results from the two surveys. which statement is true? more students do both activities at a than at b. more students watch tv at b than at a. more students do neither activity at b than at a. more students were surveyed at a than at b.
Answer
Answer:
C. More students do neither activity at B than at A.
Explanation:
Step1: Calculate students doing neither at A
In School A, from the Venn - diagram, the number of students doing neither is 3.
Step2: Calculate students doing neither at B
In School B, from the two - way table, the number of students who do not watch TV and do not use the Internet is 4.
Step3: Compare the two values
Since 4>3, more students do neither activity at B than at A. For option A: In School A, the number of students doing both is 26. In School B, from the two - way table, the number of students who watch TV and use the Internet is 30. So, more students do both at B than at A. For option B: In School A, the number of students who watch TV is 26 + 12=38. In School B, the number of students who watch TV is 30 + 5 = 35. So, more students watch TV at A than at B. For option D: In School A, the total number of students surveyed is 9+26 + 12+3=50. In School B, the total number of students surveyed is 50. So, the same number of students were surveyed at A and B.