the students in a science class took a final exam. the box - and - whisker plot (sometimes called a boxplot)…
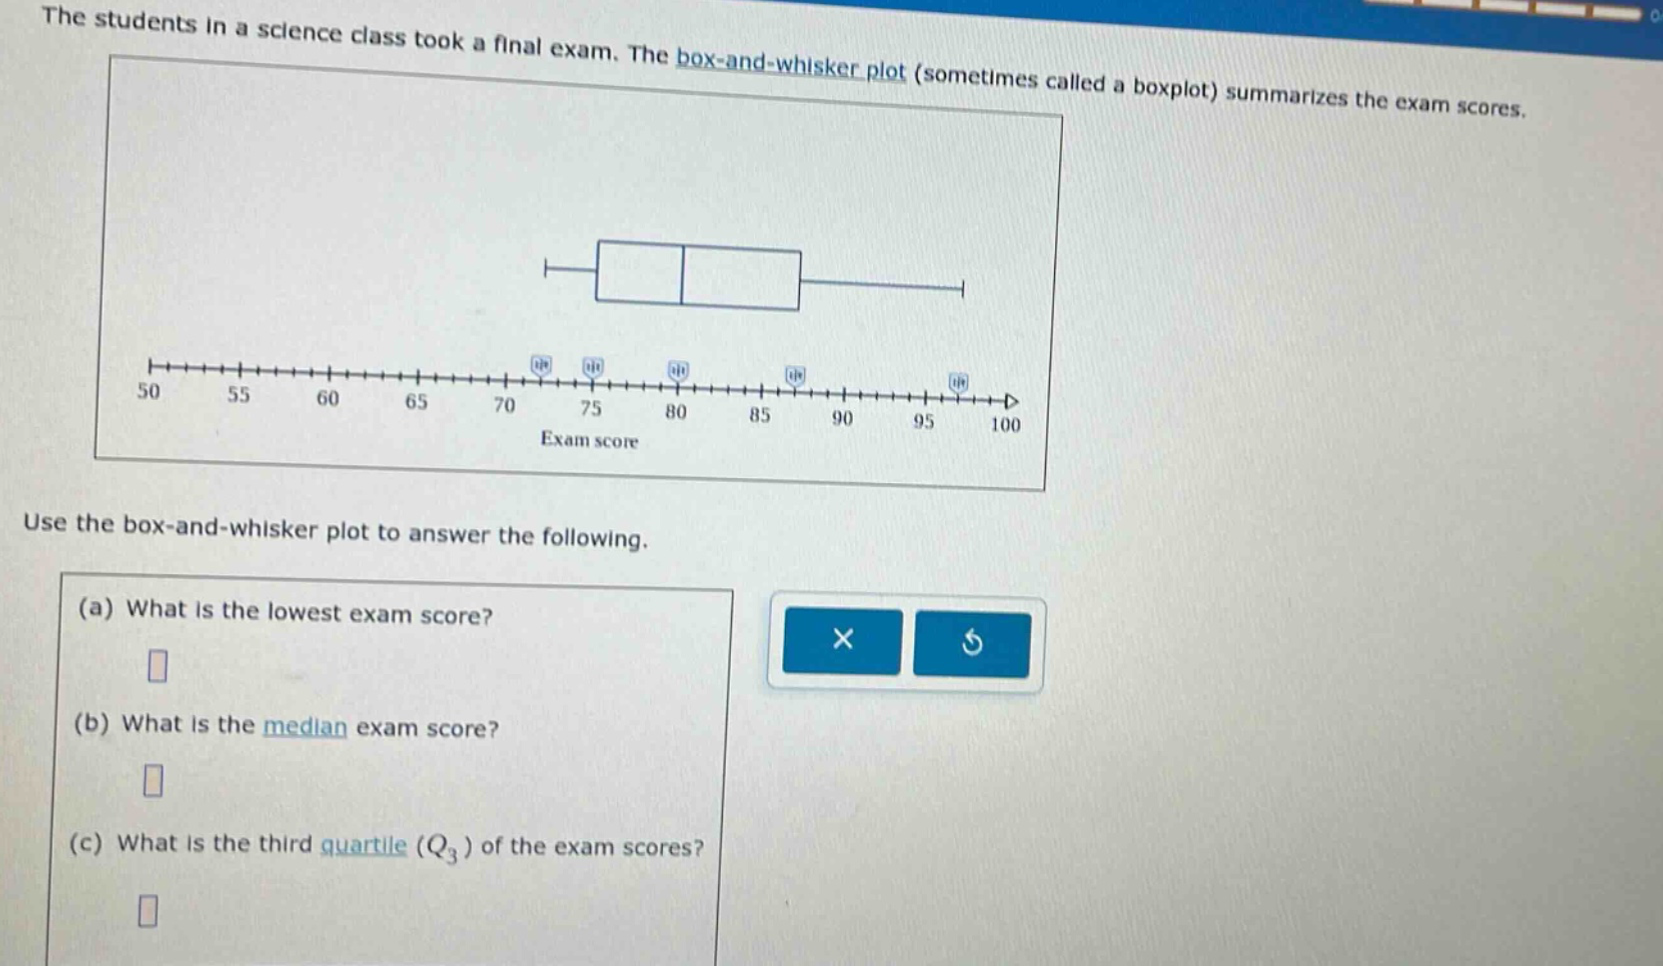
the students in a science class took a final exam. the box - and - whisker plot (sometimes called a boxplot) summarizes the exam scores. use the box - and - whisker plot to answer the following. (a) what is the lowest exam score? (b) what is the median exam score? (c) what is the third quartile (q3) of the exam scores?
Answer
Explanation:
Step1: Identify lowest score
The left - most end of the whisker represents the lowest score. From the box - and - whisker plot, it is 50.
Step2: Identify median score
The line inside the box represents the median. It is at 75.
Step3: Identify third quartile
The right - hand side of the box represents the third quartile. It is 85.
Answer:
(a) 50 (b) 75 (c) 85