a study seeks to estimate the difference in the mean fuel economy (measured in miles per gallon) for…
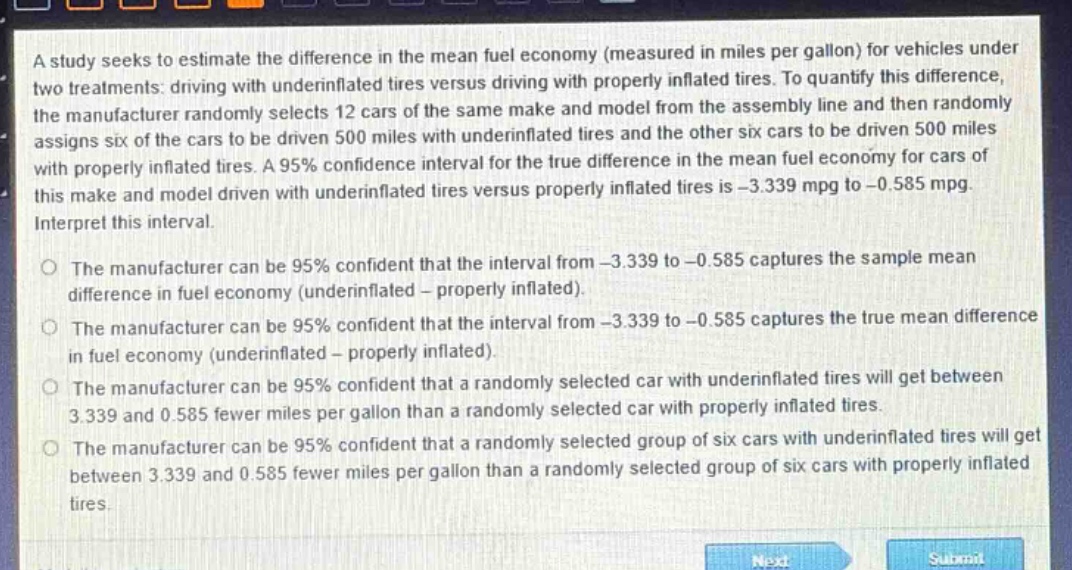
a study seeks to estimate the difference in the mean fuel economy (measured in miles per gallon) for vehicles under two treatments: driving with underinflated tires versus driving with properly inflated tires. to quantify this difference, the manufacturer randomly selects 12 cars of the same make and model from the assembly line and then randomly assigns six of the cars to be driven 500 miles with underinflated tires and the other six cars to be driven 500 miles with properly inflated tires. a 95% confidence interval for the true difference in the mean fuel economy for cars of this make and model driven with underinflated tires versus properly inflated tires is -3.339 mpg to -0.585 mpg. interpret this interval.\nthe manufacturer can be 95% confident that the interval from -3.339 to -0.585 captures the sample mean difference in fuel economy (underinflated - properly inflated).\nthe manufacturer can be 95% confident that the interval from -3.339 to -0.585 captures the true mean difference in fuel economy (underinflated - properly inflated).\nthe manufacturer can be 95% confident that a randomly selected car with underinflated tires will get between 3.339 and 0.585 fewer miles per gallon than a randomly selected car with properly inflated tires.\nthe manufacturer can be 95% confident that a randomly selected group of six cars with underinflated tires will get between 3.339 and 0.585 fewer miles per gallon than a randomly selected group of six cars with properly inflated tires.
Answer
Brief Explanations:
A confidence interval gives a range of values within which the true population parameter is likely to lie. Here, the parameter is the true mean difference in fuel - economy between under - inflated and properly inflated tires. A 95% confidence interval means that if we were to repeat the sampling process many times, 95% of the calculated intervals would contain the true population parameter.
Answer:
The manufacturer can be 95% confident that the interval from -3.339 to -0.585 captures the true mean difference in fuel economy (underinflated – properly inflated).