over the summer, aiden had a part - time job at the library. he recorded how many hours he worked each…
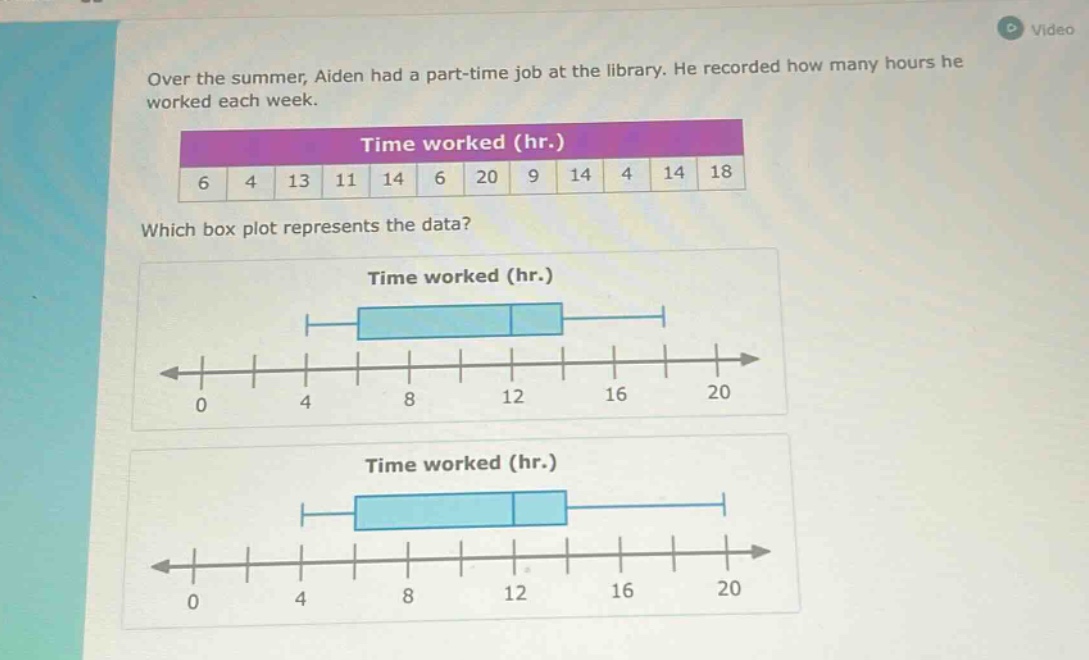
over the summer, aiden had a part - time job at the library. he recorded how many hours he worked each week.\ntime worked (hr.)\n6 4 13 11 14 6 20 9 14 4 14 18\nwhich box plot represents the data?\ntime worked (hr.)\ntime worked (hr.)
Answer
Explanation:
Step1: Arrange data in ascending order
4, 4, 6, 6, 9, 11, 13, 14, 14, 14, 18, 20
Step2: Find the median (Q2)
There are 12 data - points. The median is the average of the 6th and 7th values. So, $Q2=\frac{11 + 13}{2}=12$.
Step3: Find the lower half of data
The lower half is 4, 4, 6, 6, 9, 11. The median of the lower - half (Q1) is the average of the 3rd and 4th values. So, $Q1=\frac{6+6}{2}=6$.
Step4: Find the upper half of data
The upper half is 13, 14, 14, 14, 18, 20. The median of the upper - half (Q3) is the average of the 3rd and 4th values. So, $Q3=\frac{14 + 14}{2}=14$.
Step5: Identify the minimum and maximum
The minimum value is 4 and the maximum value is 20.
Answer:
We need to check the box - plots for a minimum of 4, Q1 = 6, Q2 = 12, Q3 = 14, and a maximum of 20. Without seeing the full set of box - plots, we can't definitively choose one, but we know the correct box - plot should have these values represented correctly (the left - most whisker at 4, the left side of the box at 6, the line inside the box at 12, the right side of the box at 14, and the right - most whisker at 20).