a survey of 20 middleton residents was done to determine the number of people in each household. the…
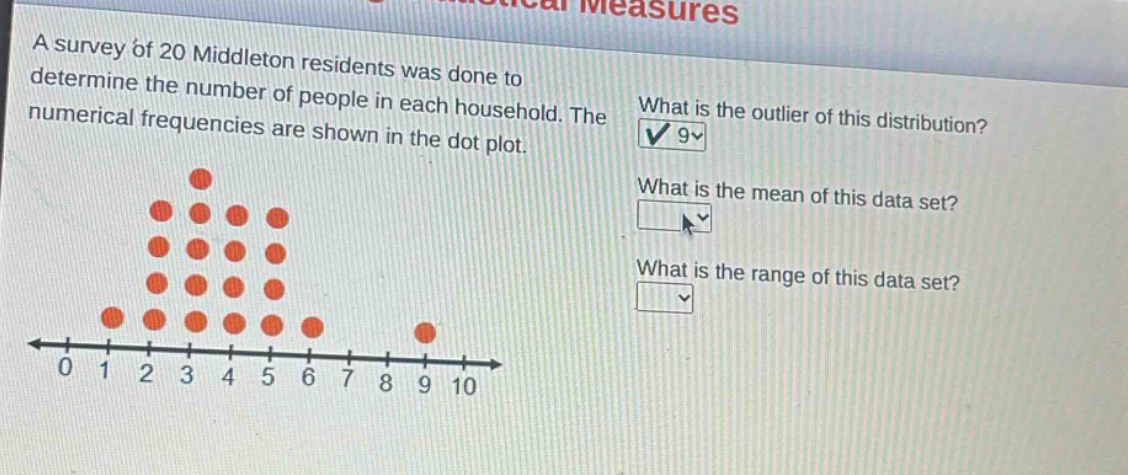
a survey of 20 middleton residents was done to determine the number of people in each household. the numerical frequencies are shown in the dot plot. what is the outlier of this distribution? what is the mean of this data set? what is the range of this data set?
Answer
Explanation:
Step1: Count data - points
From the dot - plot, the data set is: 1, 2, 2, 3, 3, 3, 3, 4, 4, 4, 4, 4, 5, 5, 5, 5, 6, 6, 9, 10. There are (n = 20) data points.
Step2: Calculate the mean
The sum of the data points is (1+2\times2 + 3\times4+4\times5+5\times4+6\times2+9 + 10=1+4+12+20+20+12+9+10 = 88). The mean (\bar{x}=\frac{\sum_{i = 1}^{n}x_{i}}{n}=\frac{88}{20}=4.4).
Step3: Calculate the range
The range is the difference between the maximum and minimum values. The maximum value is (10) and the minimum value is (1). So the range (R=10 - 1=9).
Answer:
Mean: (4.4) Range: (9)