a survey asked 50 students if they play an instrument and if they are in band.\n1. 25 students play an…
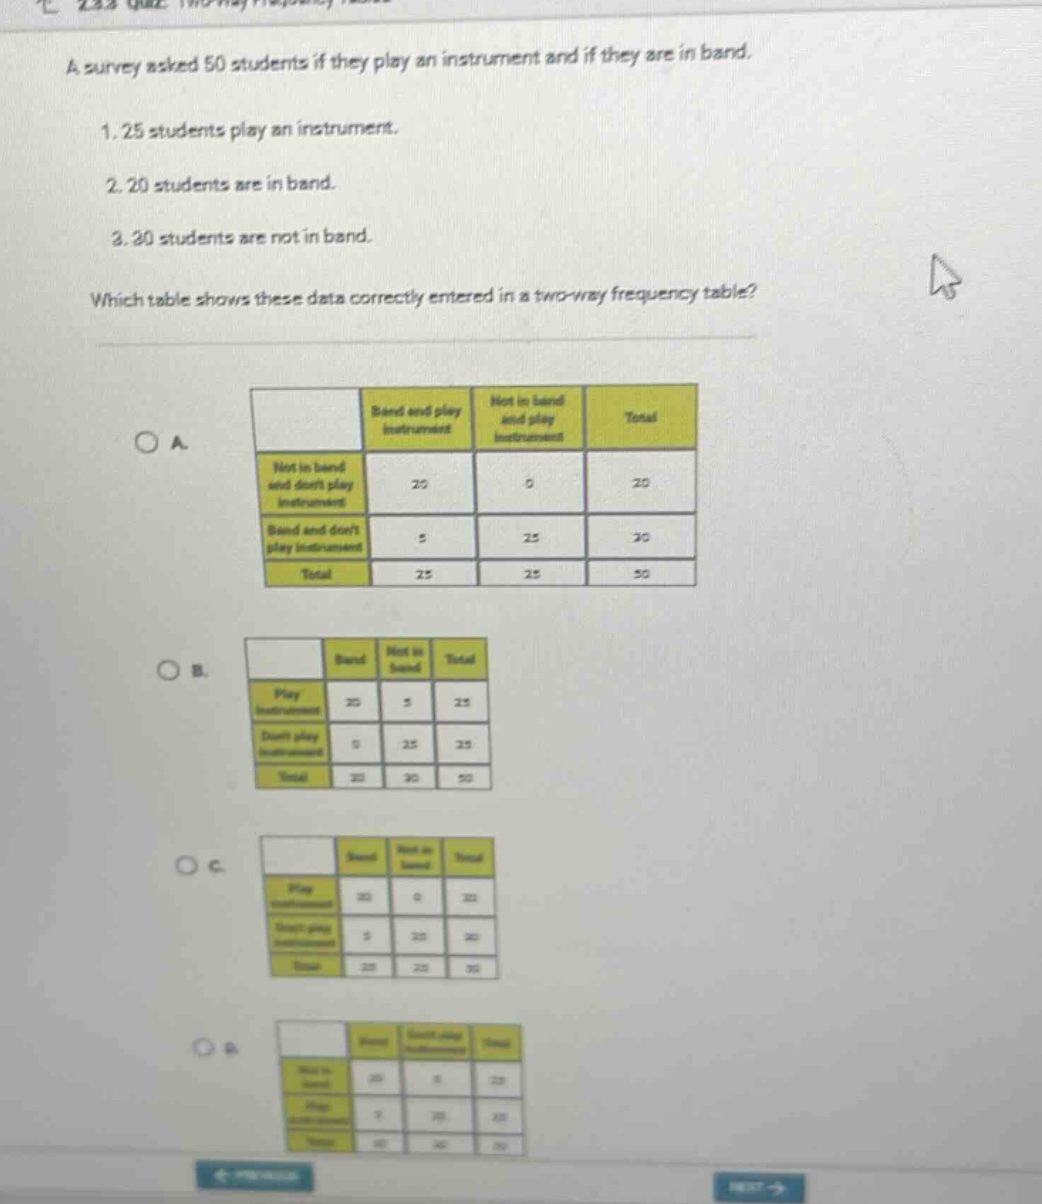
a survey asked 50 students if they play an instrument and if they are in band.\n1. 25 students play an instrument.\n2. 20 students are in band.\n3. 30 students are not in band.\nwhich table shows these data correctly entered in a two - way frequency table?
Answer
Answer:
B.
| Band | Not in band | Total | |
|---|---|---|---|
| Play instrument | 20 | 5 | 25 |
| Don't play instrument | 0 | 25 | 25 |
| Total | 20 | 30 | 50 |
Explanation:
Step1: Analyze given data
We know total students = 50, play instrument = 25, in - band = 20, not in band = 30.
Step2: Check row - totals
For the "Play instrument" row, sum of students in band and not in band who play should be 25. In option B, 20 + 5=25.
Step3: Check column - totals
For the "Band" column, sum of students who play and don't play in band should be 20 (matches). For "Not in band" column, 5 + 25 = 30 (matches). And total of all cells is 50 (matches).