a survey was conducted at a high school to study pet ownership in different grade levels. the data gathered…
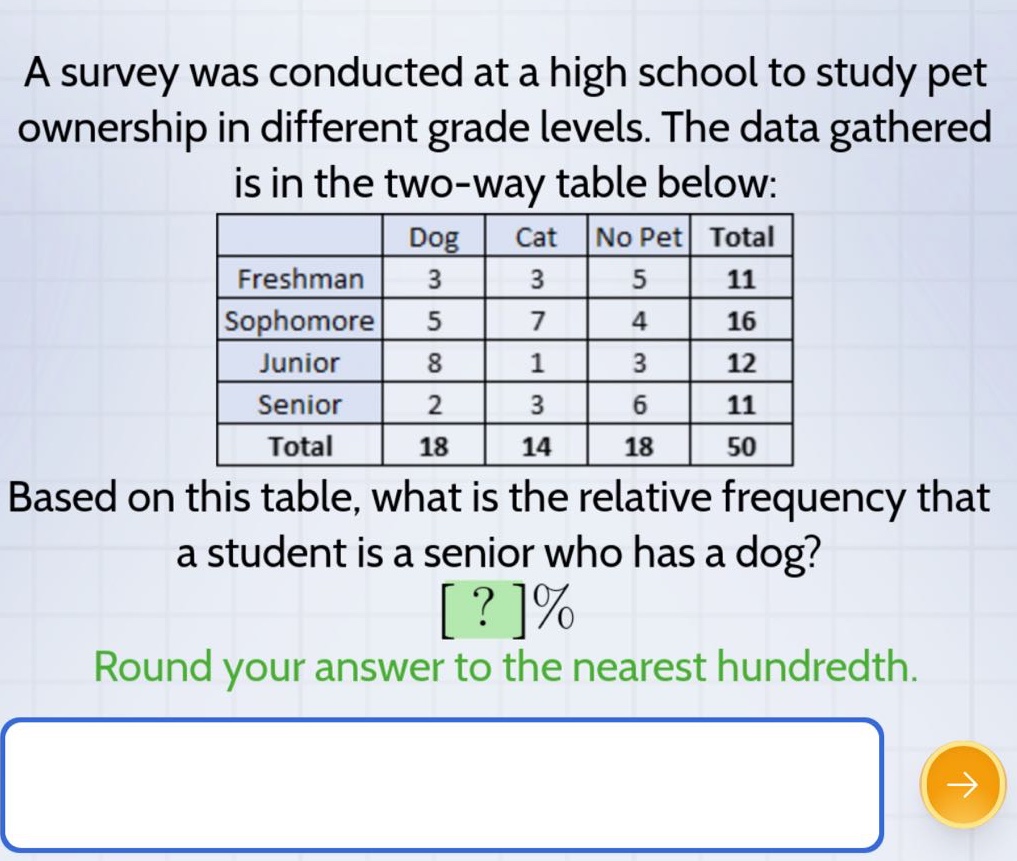
a survey was conducted at a high school to study pet ownership in different grade levels. the data gathered is in the two - way table below:\n| | dog | cat | no pet | total |\n|----|----|----|----|----|\n| freshman | 3 | 3 | 5 | 11 |\n| sophomore | 5 | 7 | 4 | 16 |\n| junior | 8 | 1 | 3 | 12 |\n| senior | 2 | 3 | 6 | 11 |\n| total | 18 | 14 | 18 | 50 |\nbased on this table, what is the relative frequency that a student is a senior who has a dog? ?% \nround your answer to the nearest hundredth.
Answer
Explanation:
Step1: Identify relevant values
The number of seniors who have a dog is 2, and the total number of students is 50.
Step2: Calculate relative - frequency
The formula for relative frequency is $\text{Relative Frequency}=\frac{\text{Number of favorable outcomes}}{\text{Total number of outcomes}}\times100%$. So, $\text{Relative Frequency}=\frac{2}{50}\times100%$. $\frac{2}{50}\times100% = 4.00%$
Answer:
4.00