a survey is conducted to study pet ownership in different age groups. the two - way table is given below:\n|…
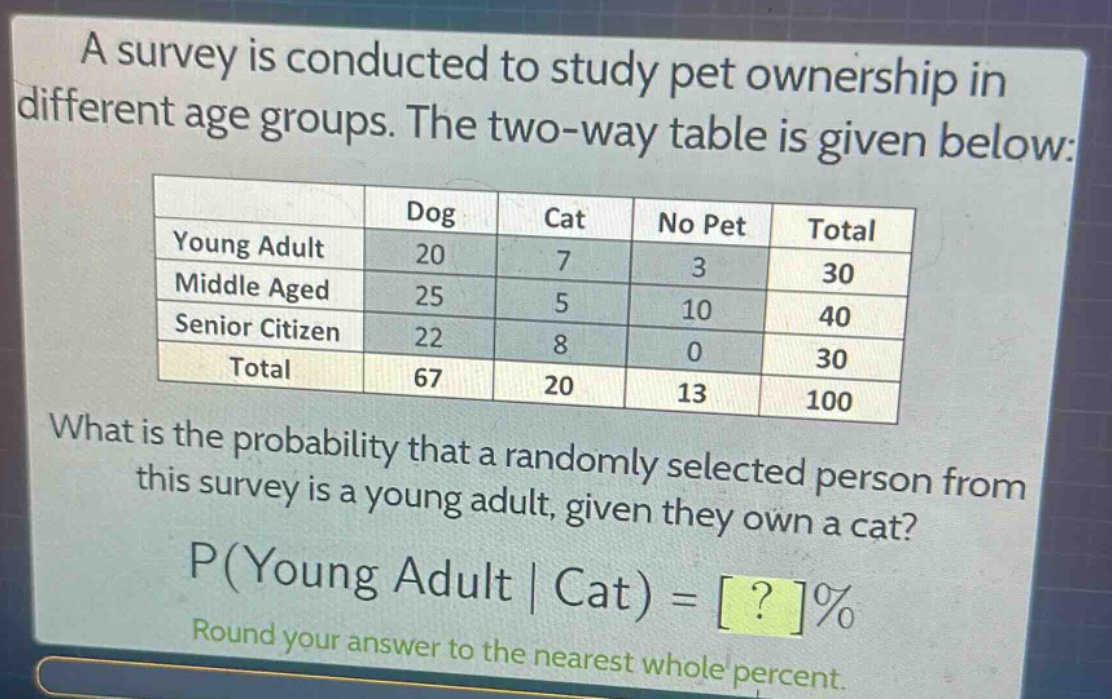
a survey is conducted to study pet ownership in different age groups. the two - way table is given below:\n| | dog | cat | no pet | total |\n|--|--|--|--|--|\n| young adult | 20 | 7 | 3 | 30 |\n| middle aged | 25 | 5 | 10 | 40 |\n| senior citizen | 22 | 8 | 0 | 30 |\n| total | 67 | 20 | 13 | 100 |\nwhat is the probability that a randomly selected person from this survey is a young adult, given they own a cat?\np(young adult | cat) = ?%\nround your answer to the nearest whole percent.
Answer
Explanation:
Step1: Recall conditional - probability formula
The formula for conditional probability is $P(A|B)=\frac{P(A\cap B)}{P(B)}$. In terms of the table, $P(\text{Young Adult}|\text{Cat})=\frac{\text{Number of young - adult cat owners}}{\text{Total number of cat owners}}$.
Step2: Identify values from the table
The number of young - adult cat owners is 7, and the total number of cat owners is 20.
Step3: Calculate the probability
$P(\text{Young Adult}|\text{Cat})=\frac{7}{20}=0.35$.
Step4: Convert to percentage
To convert the decimal to a percentage, we multiply by 100. So $0.35\times100 = 35%$.
Answer:
35%