a survey was taken of a random sampling of residents of new york city and los angeles to compare how many of…
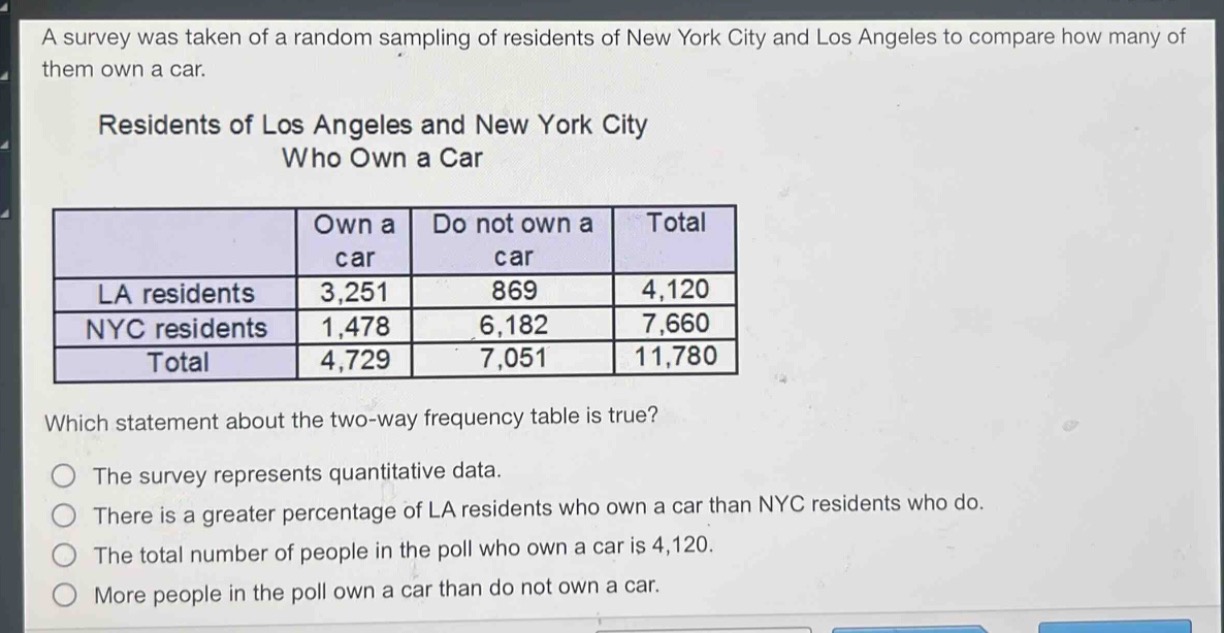
a survey was taken of a random sampling of residents of new york city and los angeles to compare how many of them own a car.\nresidents of los angeles and new york city who own a car\n| |own a car|do not own a car|total|\n|--|--|--|--|\n|la residents|3,251|869|4,120|\n|nyc residents|1,478|6,182|7,660|\n|total|4,729|7,051|11,780|\nwhich statement about the two - way frequency table is true?\nthe survey represents quantitative data.\nthere is a greater percentage of la residents who own a car than nyc residents who do.\nthe total number of people in the poll who own a car is 4,120.\nmore people in the poll own a car than do not own a car.
Answer
Answer:
B. There is a greater percentage of LA residents who own a car than NYC residents who do.
Explanation:
Step1: Calculate LA car - owning percentage
Percentage of LA residents who own a car = $\frac{3251}{4120}\times100%\approx78.91%$
Step2: Calculate NYC car - owning percentage
Percentage of NYC residents who own a car = $\frac{1478}{7660}\times100%\approx19.29%$
Step3: Analyze option A
The data is categorical (own a car or do not own a car), not quantitative. So option A is false.
Step4: Analyze option C
The total number of people who own a car is 4729, not 4120. So option C is false.
Step5: Analyze option D
The number of people who own a car is 4729 and the number of people who do not own a car is 7051. So more people do not own a car. Option D is false.