a survey was taken of a random sampling of residents of new york city and los angeles to compare how many of…
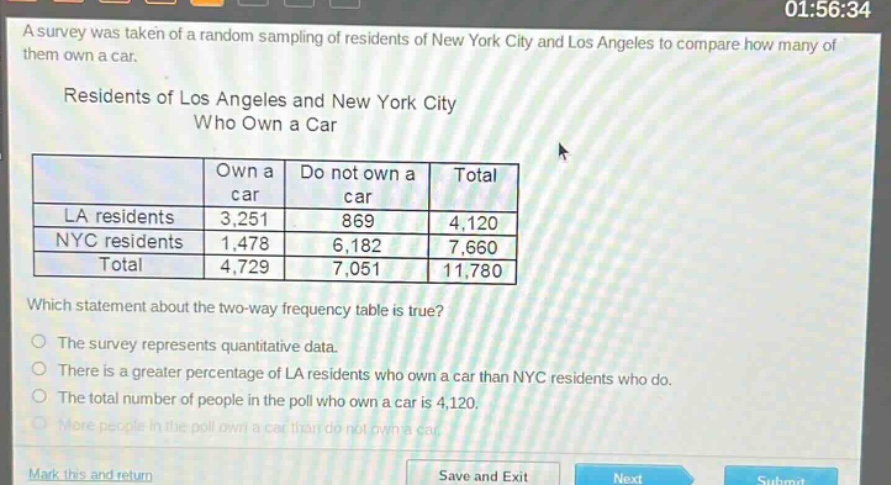
a survey was taken of a random sampling of residents of new york city and los angeles to compare how many of them own a car. residents of los angeles and new york city who own a car own a car do not own a car total la residents 3,251 869 4,120 nyc residents 1,478 6,182 7,660 total 4,729 7,051 11,780 which statement about the two - way frequency table is true? the survey represents quantitative data. there is a greater percentage of la residents who own a car than nyc residents who do. the total number of people in the poll who own a car is 4,120. more people in the poll own a car than do not own a car.
Answer
Answer:
B. There is a greater percentage of LA residents who own a car than NYC residents who do.
Explanation:
Step1: Calculer le pourcentage d'habitants de LA ayant une voiture
$\frac{3251}{4120}\times100\approx78.91%$
Step2: Calculer le pourcentage d'habitants de NYC ayant une voiture
$\frac{1478}{7660}\times100\approx19.29%$
Step3: Comparer les pourcentages
$78.91%>19.29%$, donc il y a un plus grand pourcentage d'habitants de LA ayant une voiture que d'habitants de NYC ayant une voiture.
Step4: Analyser les autres options
- Option A: Les données sont qualitatives (avoir ou ne pas avoir une voiture), pas quantitatives.
- Option C: Le nombre total de personnes ayant une voiture est $4729$, pas $4120$.
- Option D: Le nombre de personnes n'ayant pas de voiture ($7051$) est supérieur au nombre de personnes ayant une voiture ($4729$).