a swimming pool holds 30,000 gallons of water. the graph shown below represents the amount of water, in…
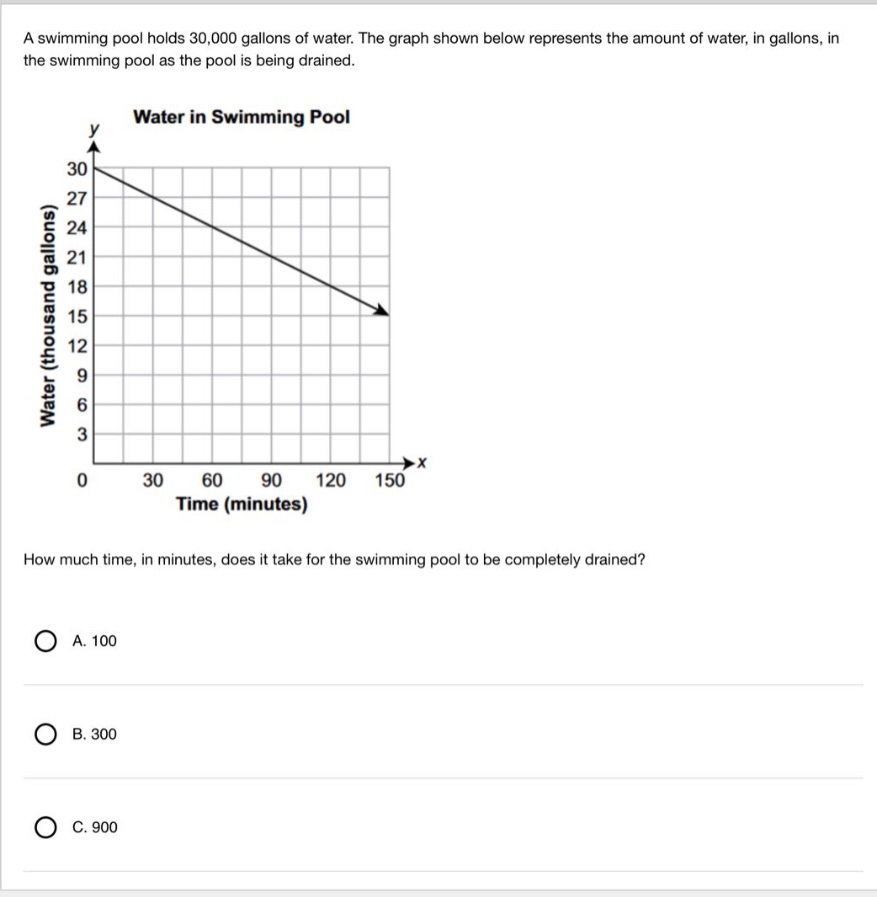
a swimming pool holds 30,000 gallons of water. the graph shown below represents the amount of water, in gallons, in the swimming pool as the pool is being drained.water in swimming poolhow much time, in minutes, does it take for the swimming pool to be completely drained?a. 100b. 300c. 900
Answer
Explanation:
Step1: Find slope of the line
First, identify two points on the line: $(0, 30)$ (initial state, 0 minutes, 30 thousand gallons) and $(150, 15)$ (150 minutes, 15 thousand gallons). Slope $m = \frac{y_2 - y_1}{x_2 - x_1} = \frac{15 - 30}{150 - 0} = \frac{-15}{150} = -0.1$
Step2: Write linear equation
Use the y-intercept $b=30$ (when $x=0$, $y=30$). The equation is $y = -0.1x + 30$, where $y$ is thousands of gallons, $x$ is minutes.
Step3: Solve for $x$ when $y=0$
Set $y=0$ (pool completely drained): $0 = -0.1x + 30$ $0.1x = 30$ $x = \frac{30}{0.1} = 300$
Answer:
B. 300