the table displays the mean name length for seven samples of students.\n| sample | mean name length |\n|…
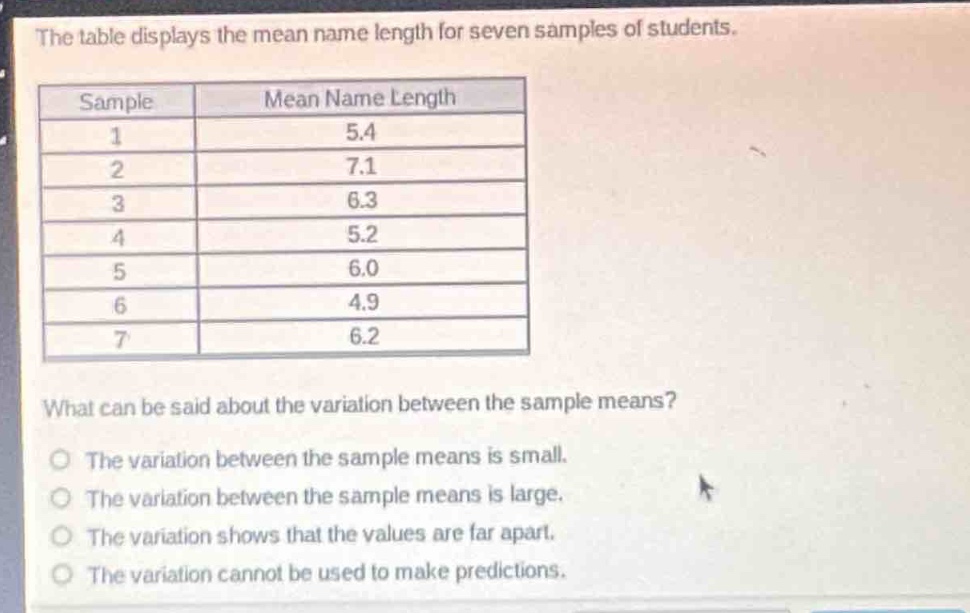
the table displays the mean name length for seven samples of students.\n| sample | mean name length |\n| ---- | ---- |\n| 1 | 5.4 |\n| 2 | 7.1 |\n| 3 | 6.3 |\n| 4 | 5.2 |\n| 5 | 6.0 |\n| 6 | 4.9 |\n| 7 | 6.2 |\nwhat can be said about the variation between the sample means?\nthe variation between the sample means is small.\nthe variation between the sample means is large.\nthe variation shows that the values are far apart.\nthe variation cannot be used to make predictions.
Answer
Explanation:
Step1: Observe data range
The values range from 4.9 to 7.1.
Step2: Analyze variation
The differences between values are relatively small.
Answer:
The variation between the sample means is small.