the table represents the temperature of a cup of coffee over time. which model best represents the data set…
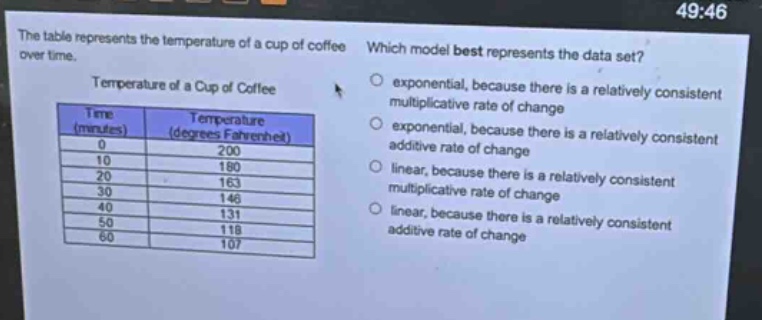
the table represents the temperature of a cup of coffee over time. which model best represents the data set? temperature of a cup of coffee time (minutes) temperature (degrees fahrenheit) 0 200 10 180 20 163 30 146 40 131 50 118 60 107 exponential, because there is a relatively consistent multiplicative rate of change exponential, because there is a relatively consistent additive rate of change linear, because there is a relatively consistent multiplicative rate of change linear, because there is a relatively consistent additive rate of change
Answer
Explanation:
Step1: Check for additive rate
Find differences in temperature for equal - time intervals. $180 - 200=- 20$, $163 - 180=-17$, $146 - 163=-17$, $131 - 146=-15$, $118 - 131=-13$, $107 - 118=-11$. The differences are not consistent, so it's not linear (no consistent additive rate).
Step2: Check for multiplicative rate
Find ratios of consecutive temperatures. $\frac{180}{200}=0.9$, $\frac{163}{180}\approx0.906$, $\frac{146}{163}\approx0.896$, $\frac{131}{146}\approx0.897$, $\frac{118}{131}\approx0.901$, $\frac{107}{118}\approx0.907$. The ratios are relatively consistent.
Answer:
exponential, because there is a relatively consistent multiplicative rate of change