the table and scatter plot show the time spent studying, x, and the midterm score, y, for each of 9…
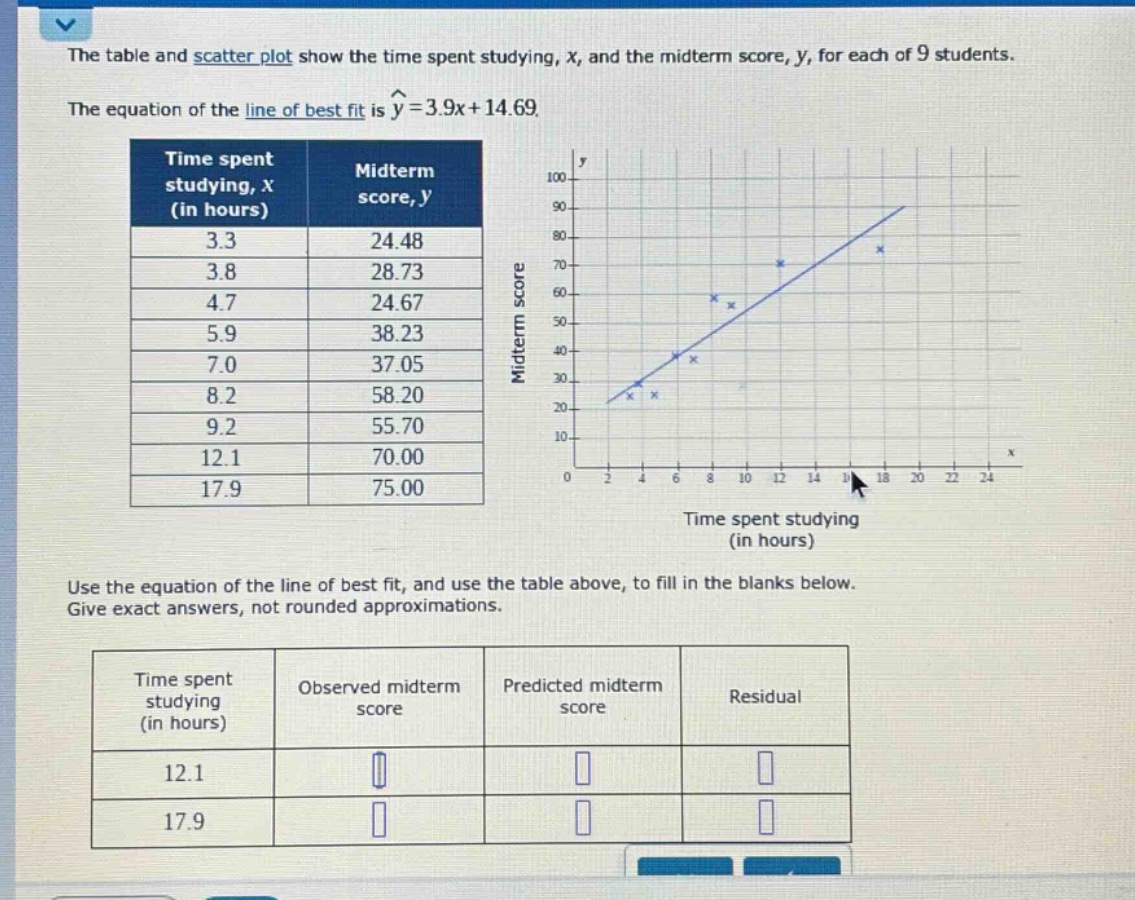
the table and scatter plot show the time spent studying, x, and the midterm score, y, for each of 9 students. the equation of the line of best fit is y^=3.9x + 14.69. time spent studying, x (in hours) midterm score, y 3.3 24.48 3.8 28.73 4.7 24.67 5.9 38.23 7.0 37.05 8.2 58.20 9.2 55.70 12.1 70.00 17.9 75.00 use the equation of the line of best fit, and use the table above, to fill in the blanks below. give exact answers, not rounded approximations. time spent studying (in hours) observed midterm score predicted midterm score residual 12.1 17.9
Answer
Explanation:
Step1: Recall the formula for predicted - value
The equation of the line of best fit is $\hat{y}=3.9x + 14.69$. The predicted mid - term score is calculated using this formula. The residual is calculated as $e=y-\hat{y}$, where $y$ is the observed mid - term score and $\hat{y}$ is the predicted mid - term score.
Step2: Calculate predicted and residual for $x = 12.1$
For $x = 12.1$, the predicted mid - term score $\hat{y}=3.9\times12.1+14.69$. $\hat{y}=3.9\times12.1 + 14.69=47.19+14.69 = 61.88$. From the table, the observed mid - term score $y = 70.00$. The residual $e=y-\hat{y}=70.00 - 61.88=8.12$.
Step3: Calculate predicted and residual for $x = 17.9$
For $x = 17.9$, the predicted mid - term score $\hat{y}=3.9\times17.9+14.69$. $\hat{y}=3.9\times17.9+14.69 = 70.81+14.69=85.5$. From the table, the observed mid - term score $y = 75.00$. The residual $e=y-\hat{y}=75.00 - 85.5=- 10.5$.
Answer:
| Time spent studying (in hours) | Observed midterm score | Predicted midterm score | Residual |
|---|---|---|---|
| 12.1 | 70.00 | 61.88 | 8.12 |
| 17.9 | 75.00 | 85.5 | - 10.5 |